Epileptic Disorders
MENUILAE Neuroimaging Task Force Highlight: harnessing optimized imaging protocols for drug-resistant childhood epilepsy
Volume 23, issue 5, October 2021

Figure 1
MRI investigations. Spanning a decade, the patient underwent a total of seven MRI scans. Color keys are shown on the right and indicate the frequency of seizures.

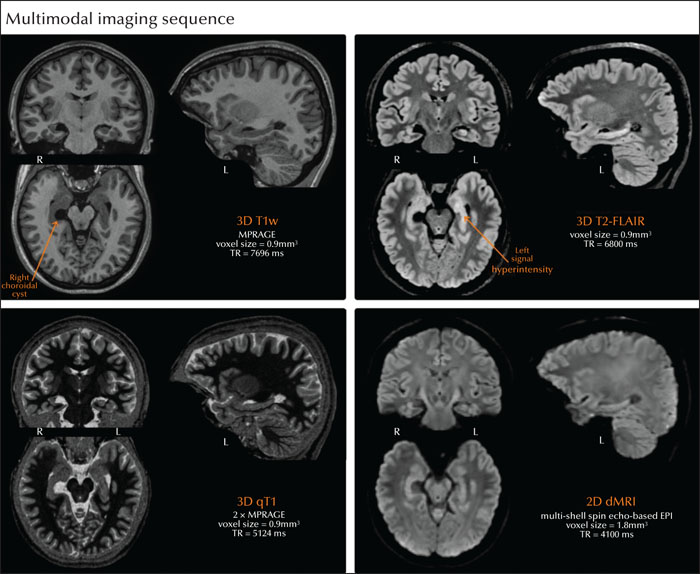
Figure 2
Multimodal MRI protocol. Multimodal MRI data obtained at 16 years old, showing the 3D T1-weighted (T1w) MRI, 3D T2-FLAIR, 3D quantitative T1 (qT1) mapping, and 2D diffusion MRI (dMRI) sequences. Arrows indicate a benign right choroidal cyst and left hippocampal T2-FLAIR signal hyperintensity.

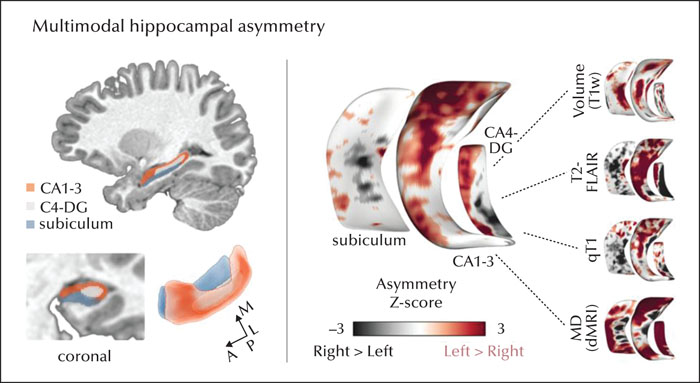
Figure 3
Multivariate hippocampal asymmetry. Asymmetry maps ([L–R]/[(L+R)/2]) using multivariate hippocampal columnar volume (obtained from T1w), mean diffusivity (MD; obtained from dMRI), as well as quantitative T1 and T2-FLAIR intensities, were used to compare left vs. right hippocampal subfields. The patient's asymmetry maps were z-scored relative to eight healthy controls (three females; mean age ±SD=12.11±3.8 years; range=6-17 years). Hippocampal subfields (CA1–3, CA4-DG, subiculum) were automatically segmented from T1w scans using a surface-based algorithm [8, 9] and their columnar volume was calculated. MD, T2-FLAIR, and qT1 intensities were sampled from medial surfaces that run through the core of each subfield. Profound multimodal alterations were observed in the left, relative to right, hippocampus, largely affecting anterior CA1-3 and CA4-DG subfields. T1w: T1-weighted; qT1: quantitative T1; dMRI: diffusion MRI; CA1-3: cornu ammonis 1-3; CA4-DG: cornu ammonis 4-dentate gyrus.

