Epileptic Disorders
MENUIctal fear during parietal seizures Volume 23, issue 5, October 2021

Figure 1
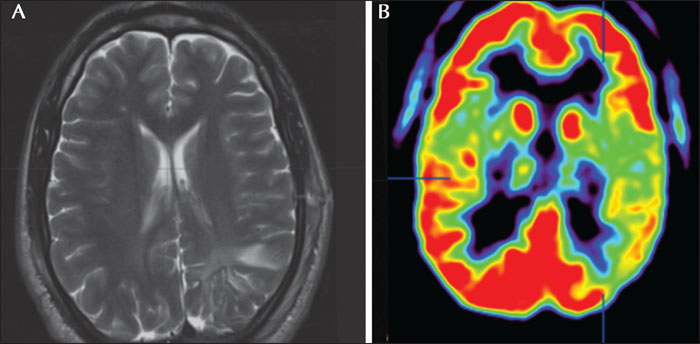
(A) T2-weighted axial MRI showing sequelae lesions, prominent in the white matter of the left parietal region. (B) FDG-PET showing hypometabolic areas in the left posterior region.

Figure 2
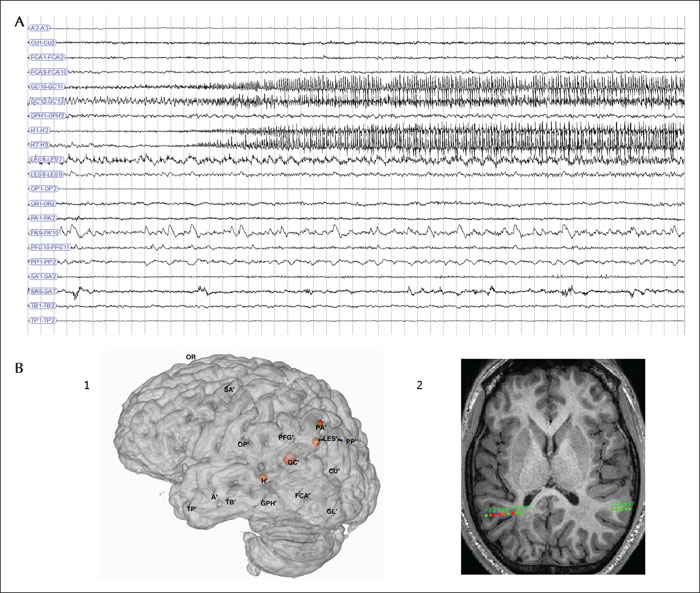
(A) SEEG trace showing the emergence of ictal activity on electrodes GC’ (contact 10-11 and 12-13 in the inferior parietal lobule) and H’ (contacts 1-2 in the Heschl gyrus and 7-8 in the lateral temporal cortex). Note the absence of involvement of the amygdala (A’ 2-3). A’2-3: left amygdala; CU1-2: right cuneus; FCA’1-2: left lingual gyrus; FCA’9-10: left anterior occipital sulcus; GC’10-11; 12-13: left supramarginalis gyrus; GPH’ 1-2: left parahippocampal gyrus; H’1-2: left Heschl gyrus; H’7-8: lateral posterior aspect of the left superior temporal gyrus; Les’7-8; 8-9: left angular gyrus; OP’1-2: left posterior insular cortex; OR 1-2: right orbitofrontal cortex; PA’1-2: left precuneus; PA’9-10: left intraparietal sulcus; PFG’10-11: posterior aspect of the left supramarginalis gyrus; PP’1-2: posterior aspect of the left superior parietal lobule. (B1) SEEG representation with projection of the left-side electrodes on a 3D MRI mesh. The red spheres indicate the regions with maximal Connectivity Epileptogenicity Index (cEI) values (left inferior parietal lobule and superior temporal gyrus). (B2) Representation of the Connectivity Epileptogenicity index (cEI) values estimated based on different contacts of the electrode GC’ and visualization of this electrode in the patient's anatomy showing maximal epileptogenicity in the inferior parietal lobule.

