Epileptic Disorders
MENULafora disease Volume 18, supplement 2, September 2016
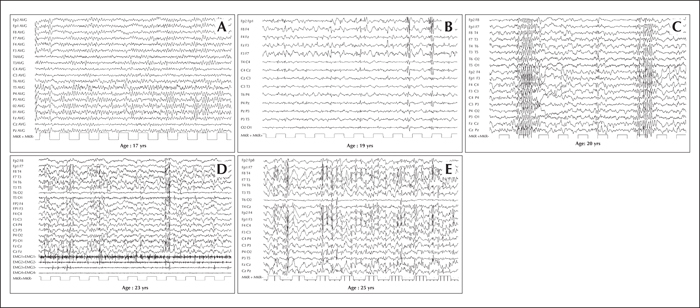
Figure 1
Progression of electroencephalographic (EEG) changes in a patient with Lafora disease. (A) At the time of disease onset (age 17 years), normal to slightly slowed background activity. (B) Two years later (age 19 years) EEG demonstrates asymmetric generalized spikes and polyspikes, maximum over the anterior regions on a slowed background. (C) At age 20 years, the occurrence of fast (4-6 cycles per second) spike-waves was concomitant with head drops. During the final stages of the disease, EEG recordings show long bursts of diffuse spike-waves and fast polyspikes associated with major volleys or massive myoclonic jerks (D), dramatically enhanced by photic stimulation at low frequency (E). Modified from Striano et al., 2008.
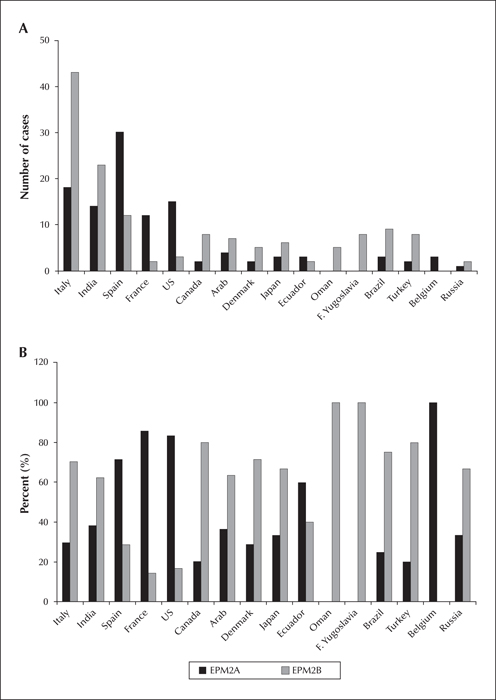
Figure 2
Number (A) and percentage (B) of EPM2A and EPM2B cases according to ethnicity/country, known to us at the time this article was prepared. Only ethnicities/countries with more than one case are shown here.
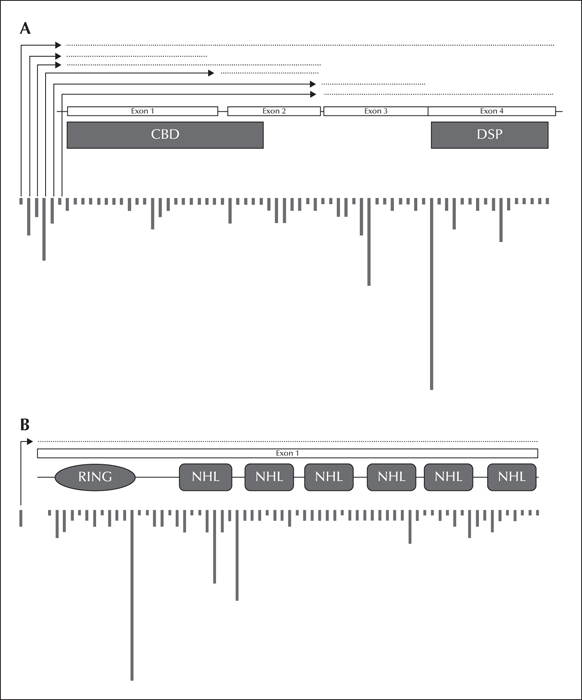
Figure 3
Location and relative frequency of EPM2A (A) and EPM2B (B) mutations; dotted lines indicate deletion mutations. Locations are approximated across each gene.
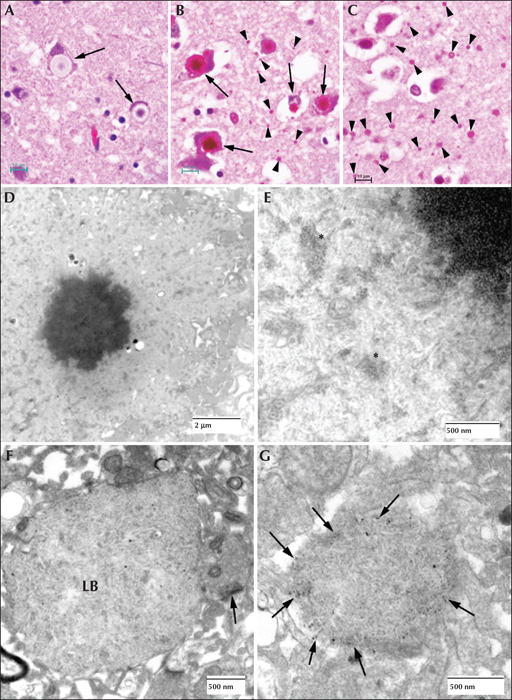
Figure 4
Lafora disease in human brain. (A) Haematoxylin and eosin (H&E)-stained section of brain obtained from an LD patient at autopsy. Arrows indicate perikaryal LBs. Note the outer pale layer and the basophilic core. (B) Diastase-digested periodic acid Schiff (PASD) section of the substantia nigra from the same patient. Note the intense staining of the perikaryl LBs (arrows) and the ‘dust-like’ LBs (arrowheads). (C) PASD-stained cerebral cortex. Note the presence of numerous ‘dust-like’ LBs (arrowheads). (D) Low-power electron micrograph of a perikaryl LB. Electron dense core is the equivalent of the basophilic core seen in H&E-stained material. (E) Higher power of (D). As well as the filamentous polyglucosans, aggregates of ‘glycogen-like’ material were frequently seen asterisks. (F) Electron micrograph of a dendritic LB. Note the synaptic density (arrow). (G) Electron micrograph of a tannic acid-stained LB. Note the presence of glycogen particles at the periphery (arrows).
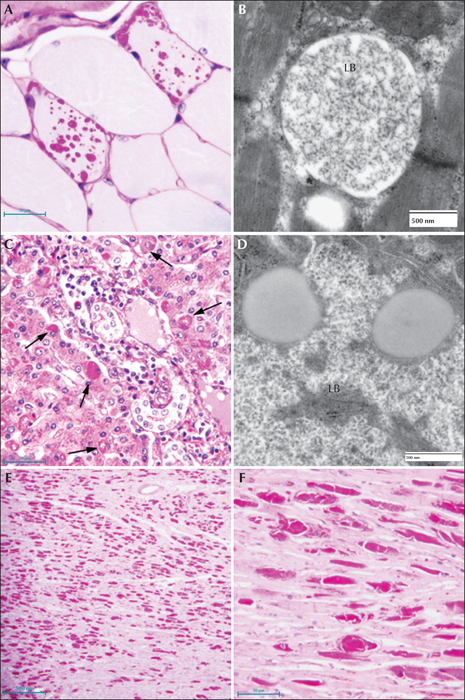
Figure 5
Lafora disease in human muscle, liver, and heart. (A) PASD-stained formalin-fixed muscle biopsy from a patient. Two of the fibres contain LBs. (B) Electron micrograph of an LB in muscle. Note that it is membrane-bound and contains both fibrillar and granular material. (C) PASD-stained hepatic periportal region of an LD patient at autopsy. Arrows indicate hepatocytes containing LBs. (D) Electron micrograph of a LB in liver from biopsy material. Note the thin cytoplasm and the predominately granular, with some filamentous, material forming the LB. (E) Low power of a PASD-stained heart from a LD patient at autopsy. Note the numerous LDs. (F) Higher magnification of (E). LBs occupied a high percentage of the sarcoplasm of the cardiac myocyte.
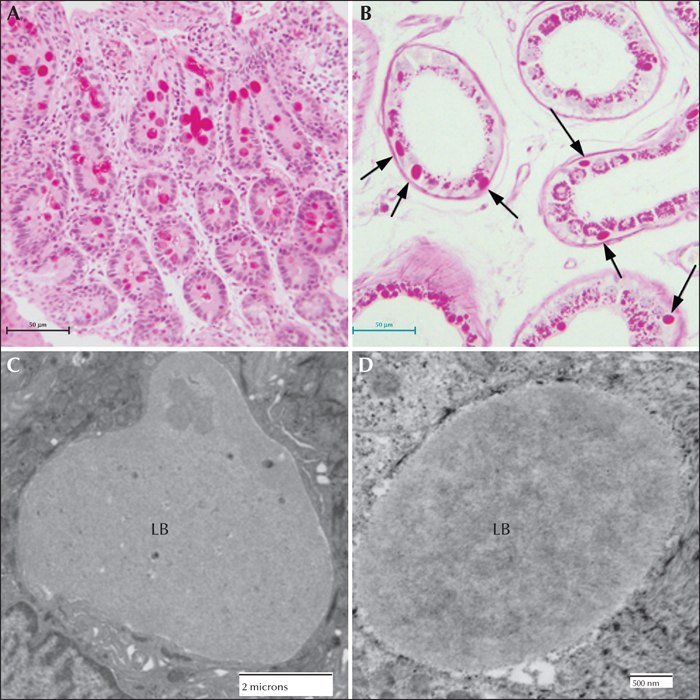
Figure 6
Lafora disease in human sweat glands. (A) PASD staining of LBs in ductile cells in eccrine sweat glands. (B) PASD staining of LBs in the myoepithelial cells of apocrine sweat glands (arrows). (C) Electron micrograph of an LB from a ductile cell in an eccrine sweat gland. (D) Electron micrograph of an LB in a myoepithelial cell from an eccrine sweat gland.
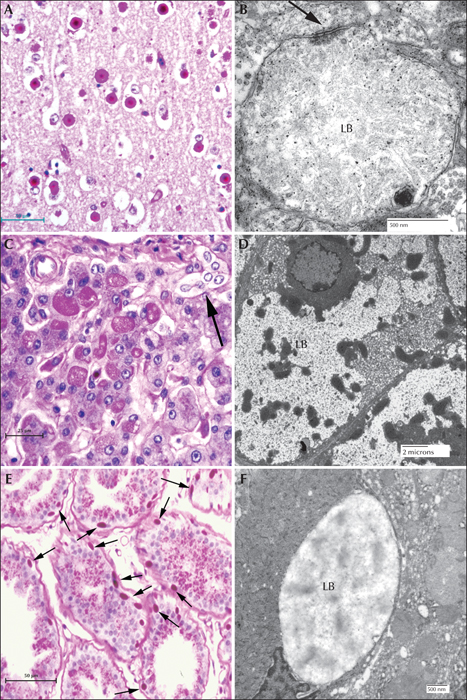
Figure 7
Canine Lafora disease. (A) PASD-stained brain from a miniature wire-haired dachshund. Numerous perikaryl and ‘dust-like’ LBs are seen. (B) Dendritic LB. Note the filamentous polyglucosans. Arrow indicates the synaptic density. (C) PASD staining of a liver from an affected dog. A cluster of hepatocytes containing LBs is seen in the portal tract. Arrow indicates a bile duct. (D) Low-power electron micrograph of a hepatocyte containing an LB (LB). Note how the majority of the cytoplasm has been pressed to the periphery of the cell. (E) PASD-stained sweat gland from the footpad of an affected dog. Note (arrows) the numerous LBs confined to the myoepithelial cells. (F) Electron micrograph of an LB in a myoepithelial cell.
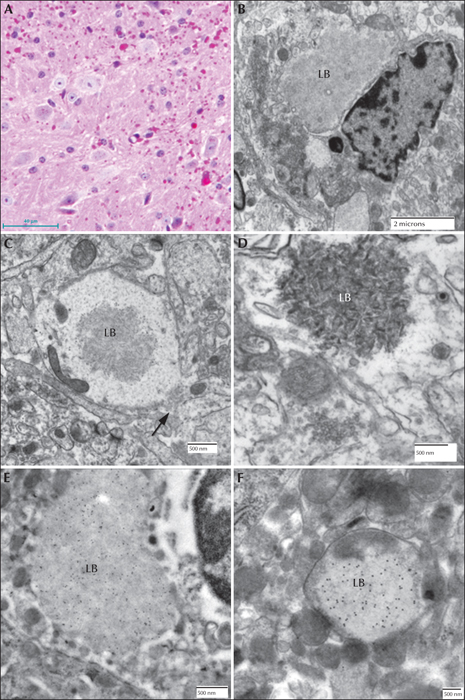
Figure 8
Lafora disease in the brain of a mouse model. (A) PASD-stained cortex from a malin-deficient mouse. Both perikaryal and ‘dust-like’ LBs are seen. (B) Electron micrograph of a juxtanuclear LB (LB) from a laforin knockout mouse. (C) Electron micrograph of a dendritic LB (LB) from a laforin-deficient mouse. Note central location of the polyglucosans within the dendrite. Arrow indicates the synaptic density. (D) Electron micrograph of an LB from a malin-deficient mouse. Polyglucosans appear thicker and more electron opaque. (E) Electron micrograph of a perikaryal LB from a myc-tagged mutant laforin over-expressing mouse, which has been immunogold labelled for myc. Gold label is confined to the LB. (F) Electron micrograph of an LB from the same mouse line as (D). Gold label is confined to the LB.
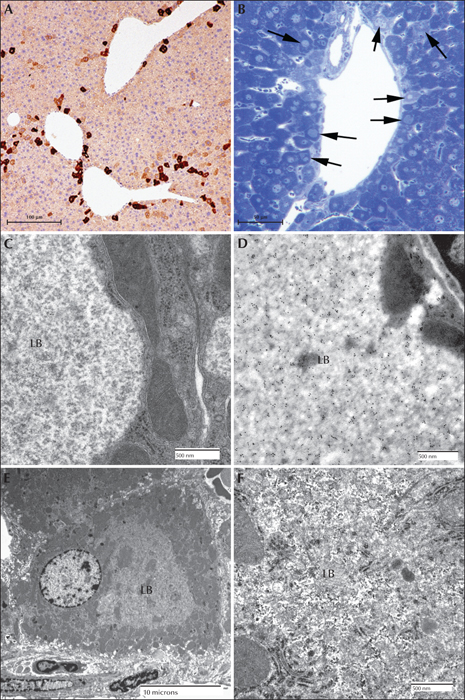
Figure 9
Lafora disease in the liver of a mouse model. (A) Low power of myc immunoperoxidase-stained liver from a myc-tagged mutant laforin over-expressing mouse. Hepatocytes with LBs were only found in zone 2 or 3. (B) Toluidine blue stained section of a portal tract from a malin-deficient mouse. Arrows indicate hepatocytes containing LBs. (C) Electron micrograph of a LB (LB) from a myc-tagged mutant laforin over-expressing mouse hepatocyte. Note how the cytoplasm has been pressed to one side. Note the predominately granular nature of the LB. (D) Electron micrograph of a LB from a myc-tagged mutant laforin over-expressing mouse hepatocyte that has been immunogold labelled with an antibody against myc. Label is confined to the LB. (E) Low-power electron micrograph of a malin-deficient periportal hepatocyte containing an LB. (F) Higher power of (E) showing that the LB contains both granular and filamentous material (LB).
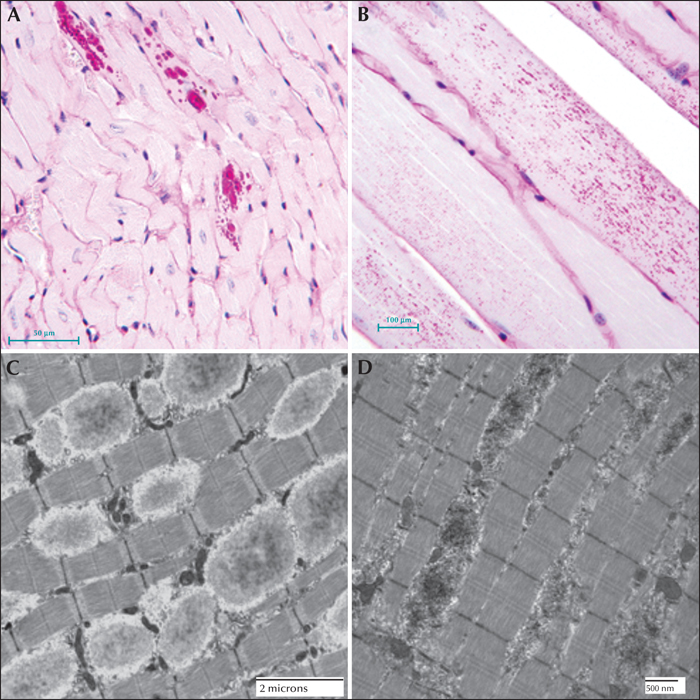
Figure 10
Lafora disease in the heart and skeletal muscle of a mouse model. (A) PASD-staining of a laforin-deficient mouse heart. LBs were detected in some of the cardiac myocytes. (B) PASD-staining of malin-deficient mouse skeletal muscle. Numerous LBs were detected in some of the muscle cells. (C) Electron micrograph of LBs in laforin-deficient mouse skeletal muscle. (D) Equivalent field in a malin-deficient mouse muscle. Note the overall electron opaque filamentous appearance of the LBs.
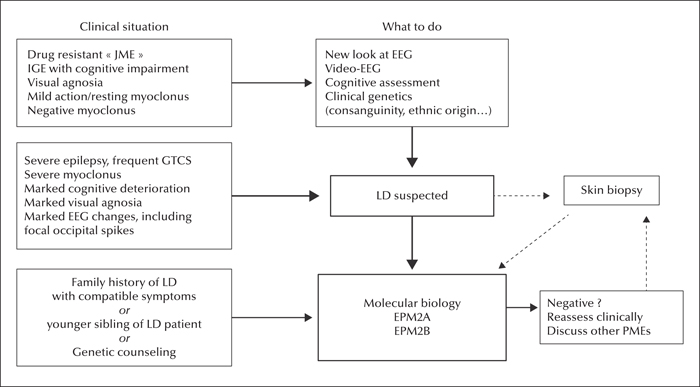
Figure 11
Management of patients with LD: diagnosis.

Figure 12
Management of patients with LD: medical and social treatment.

