Epileptic Disorders
MENUIdiopathic focal epilepsies: the “lost tribe” Volume 18, issue 3, September 2016
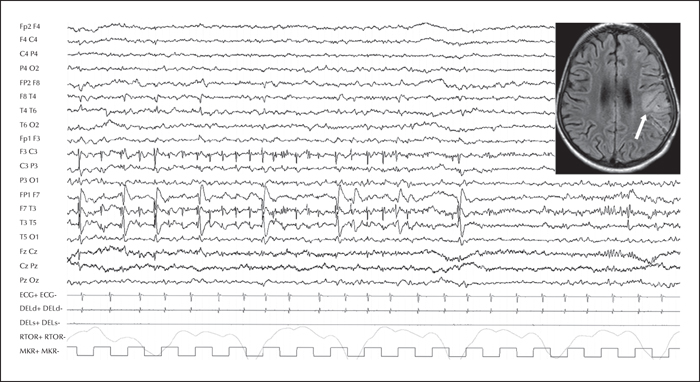
Figure 1
EEG recording of a 4-year-old girl showing normal background activity with superimposed spikes in the left centro-temporal region, and FLAIR MRI showing focal cortical dysplasia involving the left Rolandic region.
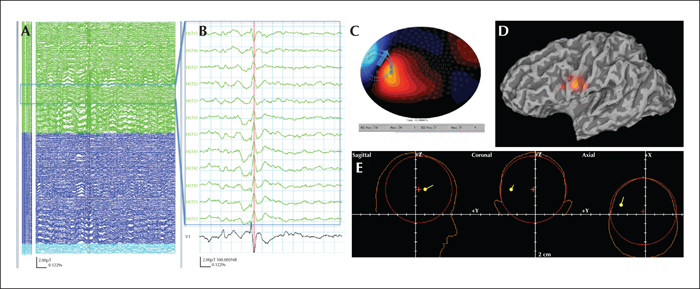
Figure 2
(A) MEG (275 channels) recording from an 11-year-old boy with BECTS. (B) Selected channels to illustrate the centro-temporal spike and lower trace, V1, and the virtual sensor electrode from the SAMg2 algorithm. (C) Flux potential and dipole illustration. (D) The synthetic aperture magnetometer (SAM) image overlaid onto the partially inflated 3D render of the structural MRI brain scan, showing the location in the inferior and anterior bank of the central sulcus. (E) The equivalent current dipole.
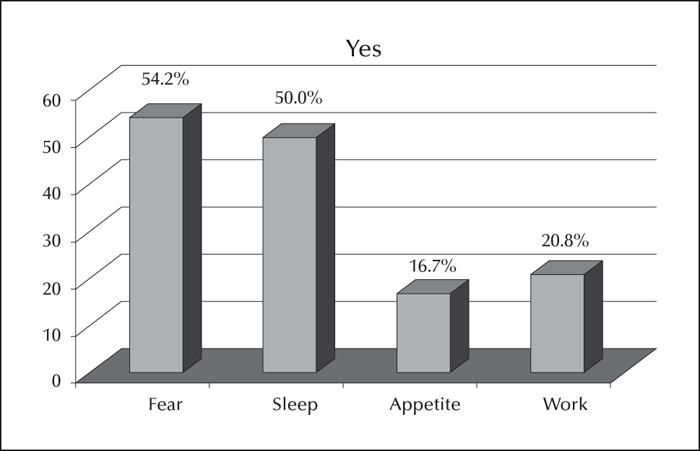
Figure 3
Results for the question: “has the event influenced you in the following areas?”
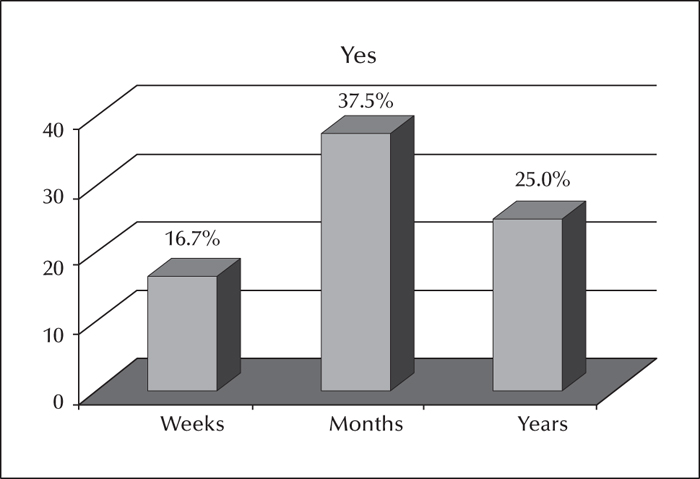
Figure 4
Results for the question: “how long has this lasted? years, months, weeks”
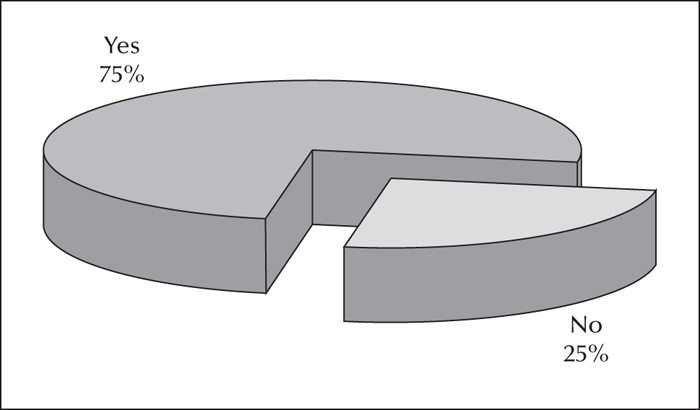
Figure 5
Results for the question: “do you need help other than medical?”
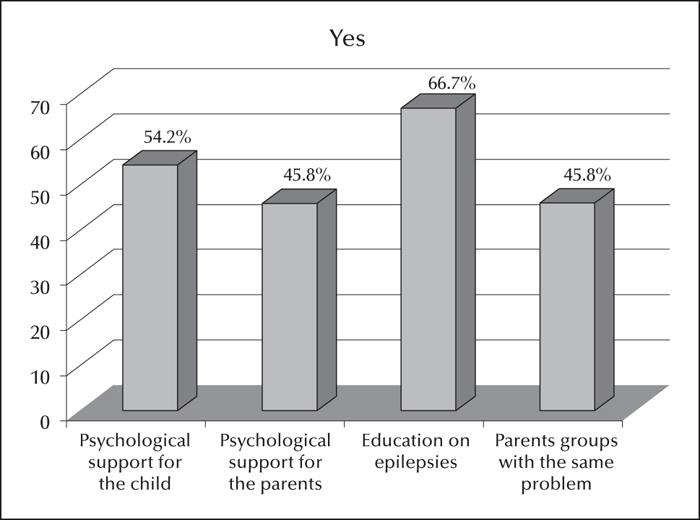
Figure 6
Results for the question: “do you need help in any of the following areas?”
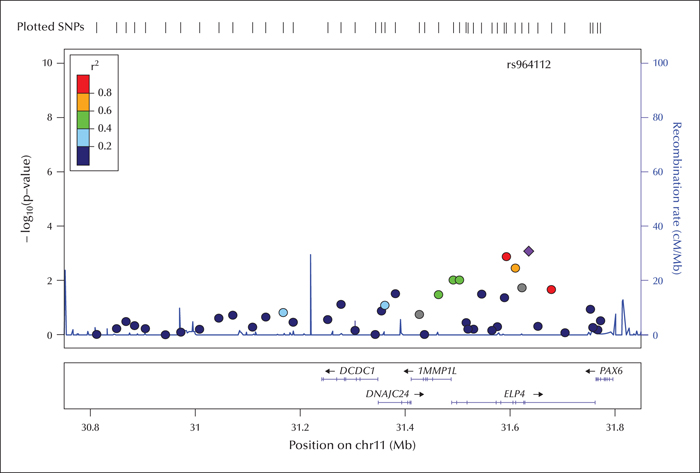
Figure 7
A plot of the association evidence for CTS in the chromosome 11p13 region (NCBI build 36, LocusZoom viewer). Colours represent HapMap CEU linkage disequilibrium r2 with the most significant SNPs, rs964112 as the purple diamond, and rs986527 as the most proximal red circle.

