Epileptic Disorders
MENUA case of anti-NMDA receptor encephalitis revealed by insular epilepsy Volume 19, issue 4, December 2017

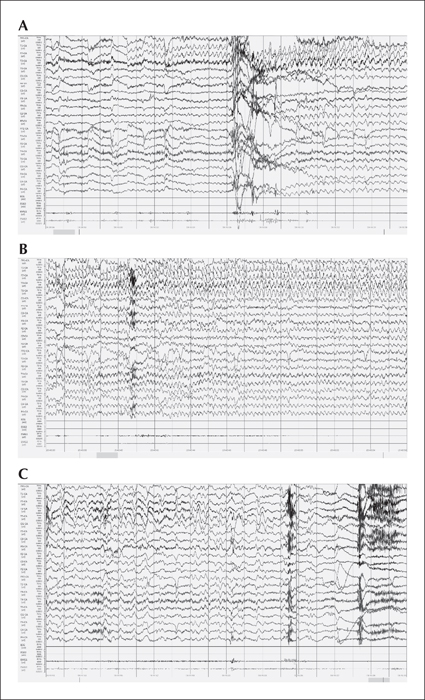
Figure 1
Three non-contiguous epochs of the ictal EEG pattern (longitudinal referential montage [common average]; 20 seconds/page; 70-Hz filter; 75 μV/cm). (A) Rhythmic delta (3-Hz) and theta activity (4-5-Hz) appearing simultaneously in left frontotemporal derivations (Fp1, F7, T1). (B) Temporal and spatial recruitment of the ictal discharge, presenting as sharp rhythmic temporal theta waves diffusing to the contralateral hemisphere. (C) Theta and delta waves becoming less rhythmic up to the end of the discharge.

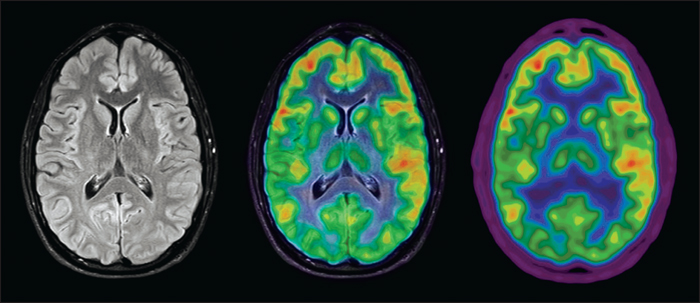
Figure 2
Brain F18-FDG PET-CT (coregistered with MRI), showing significant relative hypermetabolism of the left insular cortex, compared to the contralateral insula, with a globally preserved cortical signal.

