Epileptic Disorders
MENUMRI essentials in epileptology: a review from the ILAE Imaging Taskforce Volume 22, issue 4, August 2020

Figures
-

Figure 1 -
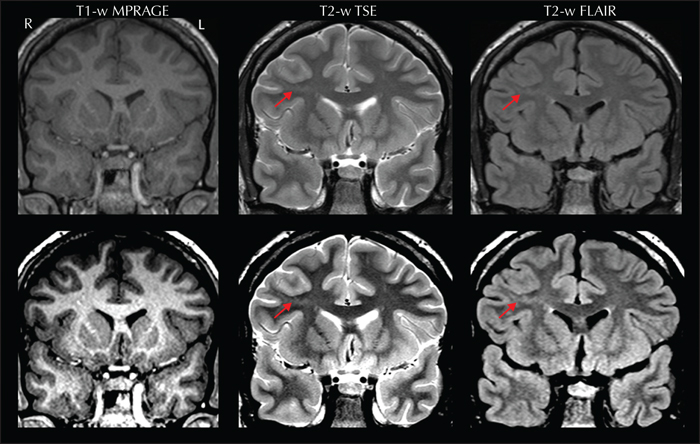
Figure 2 -

Figure 3 -

Figure 4 -

Figure 5 -
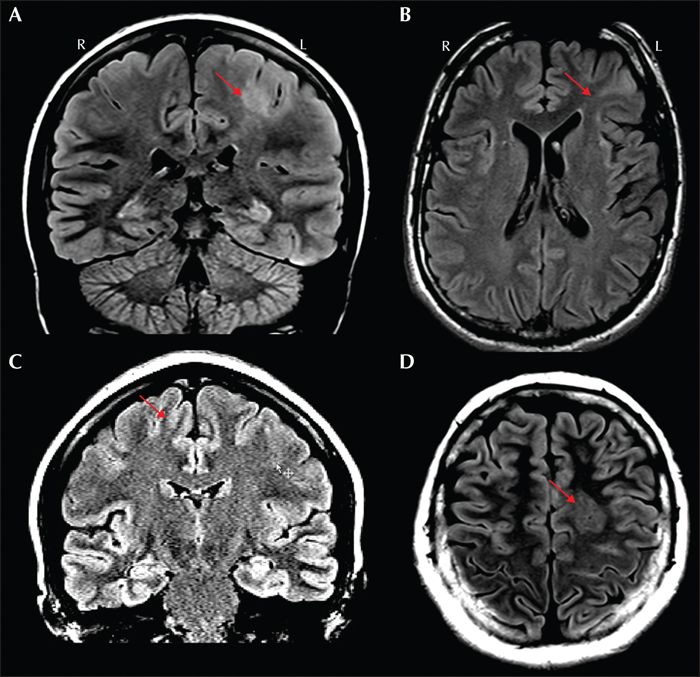
Figure 6 -

Figure 7 -
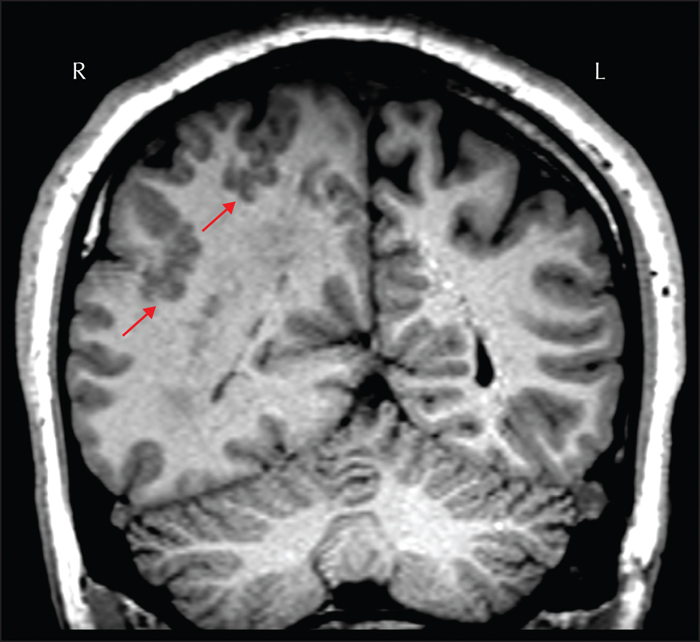
Figure 8 -

Figure 9 -
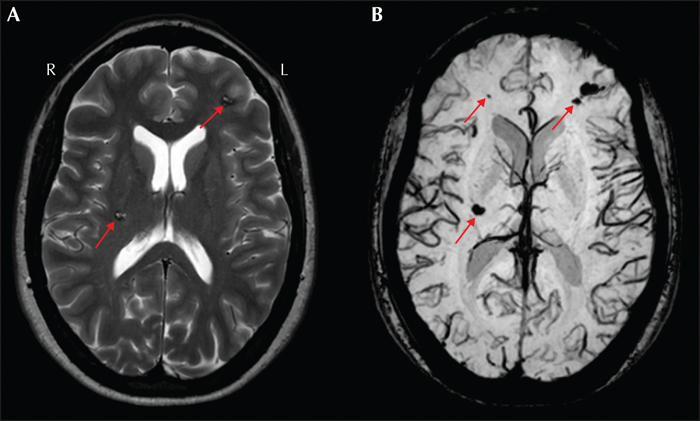
Figure 10 -
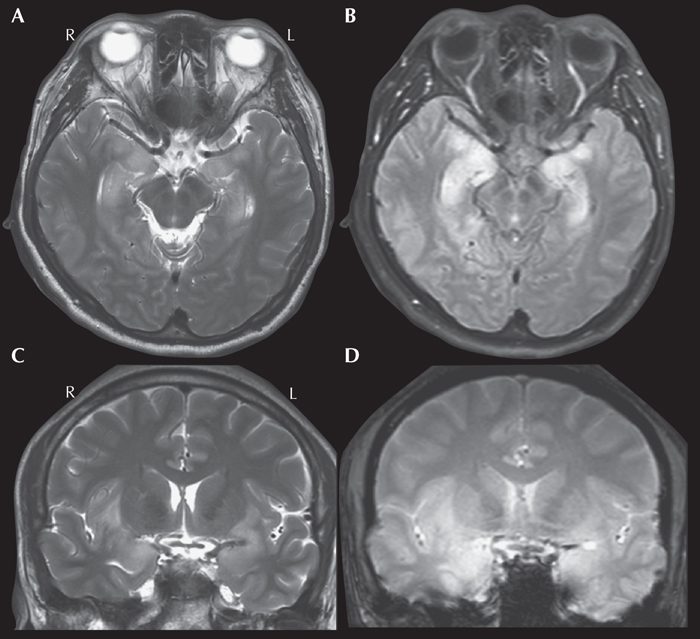
Figure 11 -

Figure 12 -

Figure 13 -

Figure 14 -

Figure 15 -

Figure 16
Tables
Overview
The Neuroimaging Task Force of the International League Against Epilepsy (ILAE) Commission on Diagnostic Methods was tasked to create an entry-level review paper intended to echo the competencies and learning objectives of the recently developed ILAE curriculum (Blümcke et al., 2019). The aim of this review is to discuss the essentials of magnetic resonance imaging (MRI) that will be useful to health care providers specializing in epilepsy, as outlined by the ILAE learning objectives (table 1). This review is also meant to complement recent consensus recommendations of the ILAE Neuroimaging Taskforce on the use of structural MRI in the care of patients with epilepsy (Bernasconi et al., 2019) and bring it to a more basic level.
MRI - principles, sequences, field strengths and safety
MRI is an important non-invasive tool for evaluation of persons with epilepsy that provides two pieces of critical information: a potentially epileptogenic brain abnormality and its surrounding anatomy. The soft tissue contrast provided by MRI makes it sensitive to small cortical lesions. In addition, the whole-brain coverage allows for the examination of lesion location in relationship to eloquent cortex. The readers are referred to the Epilepsy Imaging website (http://www.epilepsy-imaging.org) for hands-on practice sessions to review major neuroanatomical landmarks.
MRI is a versatile tool because it can be used to measure a range of tissue chemistry, including the water environment in different brain tissue types. The human body is largely composed of water molecules each containing two hydrogen nuclei, or protons. When inside a magnetic field, the magnetic moments of these protons precess more coherently about an axis aligned with the main magnetic field. When a radio frequency pulse is applied at the precession frequency, the protons will alter their alignment away from the main magnetic field (longitudinal plane) and into the transverse plane. It is the signal in transverse plane that is received by the scanner and transformed into an image. The protons in different tissues (such as gray matter, white matter and cerebrospinal fluid) return to their equilibrium state at different rates which can be characterized by two different relaxation times: longitudinal (T1) and transverse (T2). Therefore, tissues in different stages of relaxation at the time of signal detection will result in different image contrast. An MRI pulse sequence includes a series of excitations, relaxation delays and signal detection that can be “tuned” to take advantage of these different relaxation characteristics of different tissues, such as MRI sequences that are T1-weighted or T2-weighted. The flexibility offered by different contrasts can enhance differences between normal and abnormal tissues, as certain abnormalities may have similar T1 to normal tissue but very different T2, while some other types of abnormalities may have more striking T1 differences.
There are many ways to modify MRI acquisition sequences to make them more sensitive to brain pathology. The fluid attenuated inversion recovery (FLAIR) sequence, for example, is very useful for evaluation of epileptogenic lesions. The FLAIR image is similar to a T2-weighted image except that the cerebrospinal fluid is attenuated and made dark. This attenuation makes it easier for the human eye to detect bright signals related to the pathology, and therefore provides improved sensitivity for lesion detection. Note that FLAIR images are not sensitive to epilepsy-associated pathology in neonates and infants
The most commonly used MRI scanner field strengths are 1.5 Tesla (1.5T) and 3.0 Tesla (3T). A higher field strength (e.g., 3T) is capable of providing higher signal-to-noise ratio and potentially higher contrast-to-noise ratio than a lower field strength. A high signal-to-noise ratio allows increased spatial resolution, thus optimizing the detection of small focal lesions. However, scans at higher fields (e.g., 3T) might be more sensitive to motion and susceptibility artifacts (the latter are caused by air-filled cavities such as nasal cavities) than lower field scans. The recent advent of 7T MRI follows this general trend, with further improvements in resolution, yet increased motion and susceptibility sensitivity.
There are no known biological risks to the human body associated with MRI as long as there are no ferromagnetic objects in or attached to the person. Common contraindications may include cardiac pacemaker/stent, cochlear implants and neurostimulators such as vagal nerve or responsive neurostimulators. When these contraindications are encountered, it is essential to involve the MRI physicists and the system manufacturer to determine whether the patient can be safely scanned (De Jonge et al., 2014). An MRI may also cause anxiety for people due to the confined space. Some people may become anxious by the loud banging noises made by the machine. Patients can be given protective headphones that minimize the perceived noise inside the MRI scanner. Some patients may experience odd sensations such as dizziness, metallic taste or flashes of light as they go in and out of the scanner magnet. These sensations will depend on the speed of scanner table movement through the magnetic field, and typically only last for a couple of minutes.
When to perform/repeat an MRI
Because the first seizure is often evaluated in emergency settings where computerized tomography (CT) is more available, CT may be a reasonable first attempt to image the brain. CT can effectively detect most tumors (except for some low-grade tumors), large arteriovenous malformations, stroke, calcified lesions and parenchymal infections. However, small cortical lesions, particularly in orbitofrontal and medial temporal regions, are not detectable on CT. Therefore, patients with unknown etiology of their first seizure and a negative CT should undergo further evaluation with MRI, if resources allow.
In patients with recurrent seizures, an MRI should be performed early in the course to look for an underlying structural abnormality (Scheffer et al., 2017). This is because a structural abnormality on MRI considerably increases the risk of drug resistance (Berg et al., 2009). In the presence of an MRI abnormality after failing to respond to the first two antiepileptic medications (AEDs), epilepsy surgery should be considered (Wiebe and Jette, 2012). These considerations are particularly important, since epilepsy surgery is significantly under-utilized despite evidence-based practice guidelines (Engel et al., 2003; Engel, 2008).
While MRI is indicated for focal epilepsy, imaging is usually not indicated for patients with genetic and self-limited epilepsy syndromes, such as benign childhood epilepsy with centrotemporal spikes. However, an MRI should be performed when there is uncertainty about whether a patient has focal or generalized epilepsy, or if seizures are not controlled with medications. An MRI is also not indicated for those with probable syncope or when psychogenic non-epileptic seizures are strongly suspected.
Epilepsy MRI protocol
As summarized in table 2, recently the ILAE Neuroimaging Task Force recommended a set of acquisition sequences that is currently considered as the optimal epilepsy protocol, the “HARNESS”-MRI protocol (Bernasconi et al., 2019). This protocol consists of three basic, easily-implementable sequences applicable to adults and children alike. The HARNESS-MRI protocol is optimized for 3T scanners; nevertheless, these sequences can be obtained on a 1.5T MRI scanner, as long as the general guidelines shown in table 2 are followed.
Basic reading guidelines
The ability of MRI to reveal epileptogenic lesions strongly depends on the reader's experience. It is thus preferable to follow a standardized approach to reviewing a study. Notably, a detailed review can be time-consuming, especially when searching for subtle lesions, particularly small cortical dysplasias. Importantly, providing as much clinical information as possible to the neuroradiologist/epileptologist inspecting the MRI increases the yield of MRI reading. Preferably, an observer with expertise in epilepsy imaging should review the scans. It is furthermore often necessary to repeatedly review the MRI, as even experienced observers may miss small and subtle lesions. Reviewing the study in the context of new information such as positron emission tomography (PET), electroencephalography/magnetoencephalography (EEG/MEG) or other localizing information can be revealing.
When reviewing the MRI, it is important to inspect images without inter-slice gap. It is also crucial to view T1-weighted and T2-weighted images side-by-side to assess whether a putative abnormality is seen on both sequences. To evaluate whether an apparent abnormality is caused by partial volume effects, it is essential to inspect all imaging planes on the 3D sequence, i.e. coronal, axial and sagittal planes (figure 1). Detecting an abnormality on multiple sequences and multiple planes increases diagnostic confidence.
Special attention should be paid to the mesial temporal structures especially if electroclinical data suggest temporal lobe epilepsy. Coronal cuts acquired with an imaging plane perpendicular to the long axis of hippocampus (as detailed in the HARNESS-MRI protocol) allow for an optimal visualization of the hippocampal internal structure. Before comparing left-right asymmetry of volume and shape, it is important to ensure that the patient's head is symmetrically positioned in the scanner. The coronal T2-weighted turbo spin echo (TSE) sequence is optimal for comparison of volume, shape and signal, while the coronal FLAIR sequence is particularly suited to evaluate signal asymmetry. Sagittal images on 3D FLAIR sequences provide a complete antero-posterior view of signal distribution along the length of the hippocampus and parahippocampus.
Attention should also be paid to the neocortical ribbon and the white matter, particularly when electroclinical data suggest an underlying focal cortical dysplasia (FCD). A prominent feature of this cortical malformation is the transmantle sign, a funnel-shaped signal extending across the white matter, from the lateral ventricle to the cortex harboring the lesion. This feature is usually more evident on FLAIR, especially after properly adjusting the brightness and contrast of the images (figure 2). Small FCD lesions are preferentially located at the bottom of deep sulci (Besson et al., 2008); therefore, review of sulci anatomy is also crucial when suspecting dysplasias.
Common epileptic pathologies
A recent study examined resected brain specimens of approximately 10,000 patients collected over a period of 25 years who underwent epilepsy surgery (Blumcke et al., 2017). This retrospective study reported hippocampal sclerosis as the most common histopathological diagnosis among adults, and focal cortical dysplasia as the most common diagnosis among children. Tumors (mainly ganglioglioma) were the second most common lesion in both groups. The most frequent histopathological diagnostic categories reported in the study are discussed below in the order of occurrence frequency. Readers are referred to the Epilepsy Imaging (www.epilepsy-imaging.org) for hands-on practice sessions for MRI case studies of common epileptic pathologies.
Hippocampal sclerosis was seen in 36.4% of all surgical specimens, 44.5% of those from adults and 15.0% of those from children (Blumcke et al., 2017). Typical hippocampal sclerosis is characterized by atrophy, loss of internal structure, decreased T1-weighted and increased T2-weighted signal intensity in the hippocampus (figure 3); additional features may include atrophy of the ipsilateral fornix, mammillary body and the ipsilateral temporal lobe, particularly the temporal pole (Bernhardt et al., 2016; Bernasconi et al., 2019). Of note, about 40% of patients with temporal lobe epilepsy present with malrotation, a shape variant characterized by an abnormally round and vertically orientated hippocampus, and a deep collateral sulcus (Bernasconi et al., 2005). This neurodevelopmental variant also occurs in normal subjects (figure 4) and does not seem to have clear pathological significance (Tsai et al., 2016).
Brain tumors were found in 23.6% of cases, with ganglioglioma being the most frequent finding, followed by dysembryoplastic neuroepithelial tumors (DNET), both commonly found in the temporal lobe (Blumcke et al., 2017). On MRI, both tumors are isointense to gray matter on T1-weighted and hyperintense on T2-weighted images; gadolinium enhancement is variable, although more common in ganglioglioma. Dysembryoplastic neuroepithelial tumors have a typical multilobulated appearance on T2-weighted imaging (figure 5).
Malformations of cortical development were found in 19.8% of specimens and were the third most frequent histopathological category; in children, malformations of cortical development were seen in 39.3% (Blumcke et al., 2017).
Focal cortical dysplasia (FCD) accounted for 70.6% of cases of malformations of cortical development (Blumcke et al., 2017). FCD encompasses a broad spectrum of histopathological abnormalities. According to the 2011 ILAE classification system (Blumcke et al., 2011), FCD type I has abnormal radial and/or tangential lamination; FCD type II has dysmorphic neurons (IIa without and IIb with balloon cells). Many radiological features, such as abnormal cortical thickness, indistinct gray-white junction, T1-weighted and T2-weighted signal abnormalities are shared by different FCD subtypes (Hong et al., 2017); therefore, visual determination of FCD subtypes on conventional MRI is challenging and often inconclusive (Kim et al., 2012). The only exception is that the transmantle sign (figure 2) is generally associated with FCD IIb (Kim et al., 2012; Mühlebner et al., 2012). Figure 6 illustrates examples of FCD type IIa and IIb.
Polymicrogyria is characterized by regions of cerebral cortex with excessive localized, small-scale gyration. The distribution of polymicrogyria can be unilateral, bilateral symmetric or bilateral asymmetric, mostly seen in the perisylvian region (figure 7). Seizures are intractable in at least 50% of patients.
Hemimegalencephaly is a brain malformation characterized by an abnormally enlarged and dysplastic cerebral hemisphere (figure 8). Seizures are usually refractory to medication. Anatomical or functional hemispherectomy are commonly performed for seizure control.
Periventricular nodular heterotopia is often found in the periventricular region or subcortical white matter, suggesting a migration failure of neurons from the ventricle to the cerebral cortex (figure 9). The nodules may be single or multiple, unilateral or bilateral, large or small, and symmetric or asymmetric. The signal intensity is isointense to cortical gray matter. Seizures due to periventricular nodular heterotopia are usually intractable to medications.
Temporal lobe encephalocele is a developmental abnormality of high epileptogenicity, with excellent outcome with resection and is commonly missed if not specifically looked for (Abou-Hamden et al., 2010).
Vascular malformations were found in 6.1% of specimens, with cavernous angiomas in the temporal lobe being the most frequent type (Blumcke et al., 2017). The MRI appearance of a cavernous malformation is typically multi-cystic, with various T1-weighted and T2-weighted signal intensities reflecting blood products of various ages (Rosenow et al., 2013). Cavernous malformations (also known as cavernomas) can occur as single or multiple lesions (figure 10A). Because of the hemosiderin content, gradient echo sequence or susceptibility weighted imaging sequence can increase the sensitivity to detect small cavernomas (figure 10B). Individuals with cavernomas that have cortical involvement are more likely to have epilepsy than those with subcortical lesions; additionally, mesial temporal cavernomas are associated with more severe epilepsy (Rosenow et al., 2013). Other vascular lesions associated with refractory seizures include ischemic and hemorrhagic stroke, as well as subdural hematoma.
Glial scars (gliosis) were found in 4.9% of specimens and can be associated with FCD (FCD type III) according to the 2011 ILAE classification system (Blumcke et al., 2011). Gliosis is hyperintense on T2-weighted scans and is often associated with cortical atrophy, best seen on T1-weighted scans. It is most commonly seen following significant head trauma, intracranial infections, neurosurgical procedures, or due to unknown cause.
Encephalitis and other infections. A total of 1.5% of patients had a histopathological diagnosis of encephalitis, most frequently Rasmussen's encephalitis, affecting multiple lobes. MRI characteristics of Rasmussen's encephalitis include early cortical swelling followed by cortical and subcortical hyperintensity on FLAIR and other T2-weighted images with progressive atrophy of the affected hemisphere. The perisylvian region has been observed to be the predominant site for signal abnormality and atrophy. Volume loss of the ipsilateral caudate head is also frequently observed (Varadkar et al., 2014). While Rasmussen's encephalitis was the most common encephalitis (Blumcke et al., 2017), it is uncommonly seen in routine clinical practice. Instead, the most common encephalitis seen is herpes simplex encephalitis (figure 11). In adults, herpes simplex encephalitis typically affects the limbic system, including the mesial temporal lobes, insula, and inferior frontal lobes, often with bilateral asymmetrical involvement. Key changes in the affected areas include hyperintensity on T2-weighted sequences, hypointensity on T1-weighted images and restricted diffusion on diffusion-weighted imaging/apparent diffusion coefficient images. If complicated by hemorrhage, T1-weighted hyperintensity/T2-weighted hypointensity may also be seen. Contrast enhancement (leptomeningeal, diffuse) may also be observed later in the disease course. Notably, the most common cause of infection-related epilepsy worldwide is neurocysticercosis; MRI changes are varied and depend on the location and stage of the disease (figure 12). The cysts are usually 1-2 cm and can be parenchymal, usually in the grey-white matter junction, or they can be located in the subarachnoid space or intraventricularly. There are four main stages. The vesicular stage consists of a viable parasite, with an intact membrane, and no host reaction. On MRI, the cyst is CSF density, with a dot sign and sometimes a hyperintense scolex can be seen. In the colloid vesicular stage, which is the most symptomatic stage, the parasite dies within 4-5 years if untreated and the cyst fluid becomes turbid, and edema ensues as the membrane becomes leaky. On MRI, the cystic fluid is T1 hyperintense to CSF, there is surrounding edema, and the scolex can often still be seen. The cyst wall also thickens and shows strong enhancement. In the granular nodular stage, the cyst size, edema, and enhancement all decrease. The final stage is the nodular calcified stage, where a quiescent calcified cyst remnant remains with no edema and loss of T2 signal. There is usually no enhancement and if found, this could suggest ongoing seizures.
“MRI-negative” epilepsy
Up to 50% of patients with drug-resistant epilepsy evaluated for surgery have no apparent lesion based on visual inspection of the MRI. These cases are usually referred to as having non-lesional or MRI-negative epilepsy (Bernasconi et al., 2011). The definition of MRI-negative, however, largely depends on the party viewing the scan. In many instances, the initial MRI scan may be interpreted as being negative; however, a second focused review, at times supported by additional information provided by ancillary tests, may reveal the lesion.
FCD is the most common pathologic substrate in epilepsies with a negative MRI (Wang et al., 2013). FCD lesions can be very subtle and masked by the complex neocortical convexities. Their detection may be even more difficult when non-invasive clinical data, such as scalp EEG and semiology, are also non-localizing. In MRI-negative cases, one should first determine if the MRI scan was acquired using HARNESS-MRI epilepsy protocol (Bernasconi et al., 2019). In the presence of artifacts related to subject motion, which greatly affect scan interpretation, it is imperative to repeat the MRI, preferably at 3T. Sedation may also be required for anxious, claustrophobic, or pediatric patients. One should further evaluate whether the review of the MRI was specialized and considered significant relevant to epilepsy (see previous section “Basic Reading Guidelines”); if not, focused re-review should be performed, particularly when multimodal data point to a potential epileptogenic zone, as illustrated in figure 13. Small bottom of sulcus dysplasia, temporal pole encephaloceles, hypothalamic hamartomas and subtle double cortex should be specifically looked for in MRI-negative cases as these diagnoses could change management and prognosis.
MRI post-processing, which enhances typical characteristics of the epileptic tissue, can be applied to assist the search for subtle FCD lesions. Some of these post-processing algorithms include voxel-based morphometry, texture analysis, curvilinear reformatting and surface-based morphometry. Post-processing algorithms generally operate on 3D T1-weighted volumetric data with whole-brain coverage using statistical maps to direct the reader's attention to potential abnormalities. This allows the simultaneous consideration of information from consecutive slices, whereas conventional visual analysis examines the brain volume one slice at a time. Also, post-processing can be done retrospectively (as long as the 3D T1-weighted volumetric sequence is available) and does not require additional imaging. Post-processing yields increased sensitivity for subtle lesions that escaped initial visual inspection (Wagner et al., 2011; Hong et al., 2014; Wang et al., 2015). In selected centers, ultra-high field 7T MRI may be performed, with some data showing increased lesion visibility (De Ciantis et al., 2016; Veersema et al., 2017; Guye et al., 2019). The yield of ultra-high-field MRI remains to be further studied and clarified.
Functional MRI (fMRI)
Almost all functional MRI acquisitions capitalize on the blood oxygen level-dependent (BOLD) effect to indirectly infer brain activity via T2* acquisitions (Logothetis, 2003). These sequences are sensitive to changes in magnetic susceptibility as a result of blood oxygenation, as oxygenated hemoglobin is diamagnetic while deoxygenated hemoglobin is paramagnetic. Although the precise relationship between neural activity and BOLD is still the subject of investigation, local neural activity generally leads to increases in cerebral blood flow through neurovascular coupling. This, in turn, results in a decrease of deoxygenated hemoglobin and an increase in local field homogeneity, and therefore a small increase in the T2* signal in regions with increased neural activity.
fMRI can be used to image brain activities in response to an external task. Changes in T2* in response to task conditions are usually very small (<10%). Therefore, to detect and localize the signal increase, a number of images need to be acquired during the performance of the task and during control or rest periods. The task and control images are then statistically compared to localize the regions of signal increases associated with the task performance (task activation). This requires the ability to acquire T2*-weighted images every few seconds for the duration of the study. Tasks are usually directed to the patient via visual or auditory prompts. The hardware and software requirements for performing fMRI include the availability of the proper MRI sequences for acquisition, proper task delivery, and image post-processing software to identify activation. Importantly, trained imaging experts are needed to identify brain activations in an fMRI dataset. A more detailed description of how task-based fMRI is provided can be found elsewhere (Silva et al., 2018; Agarwal et al., 2019).
Task-based fMRI has been widely used in the context of the presurgical workup to determine or confirm language hemispheric dominance, often in the setting of temporal lobe resection in the dominant hemisphere (figure 14). Due to its non-invasiveness, it provides more precise localization and is more cost-effective than the Wada test (also known as the intracarotid amobarbital procedure), particularly in patients with left-lateralized language (Bauer et al., 2014). According to the Practice Guideline of American Academy of Neurology, fMRI using verbal memory or language encoding should be considered for predicting postoperative verbal memory outcome (Level B recommendation) (Szaflarski et al., 2017). fMRI using non-verbal memory encoding may be considered for predicting postoperative visuospatial memory outcomes (Level C recommendation) (Szaflarski et al., 2017). Patients may be unsuitable for task-based fMRI language mapping because of claustrophobia, implanted devices, and inability to perform activation tasks. In this situation, the intracarotid amobarbital procedure should be performed for language and memory lateralization. A recent study also indicated that reliability of fMRI could be limited in patients with non-typical lateralization and the intracarotid amobarbital procedure is warranted when fMRI fails to show clear left lateralization (Bauer et al., 2014).
Functional MRI can also be used in mapping of primary motor, somatosensory cortex, or visual cortex. It is particularly useful when an epileptic pathology, such as tumor, gliosis, or FCD, is in or close to the eloquent cortex. Notably, distortion of the local anatomy makes prediction of the eloquent cortex difficult, as functional reorganization can be unpredictable in the presence of these lesions.
Over the past decade, simultaneous scalp EEG combined with fMRI (EEG-fMRI) has been increasingly used to map the patterns of brain activation associated with focal, mostly interictal epileptiform discharges (figure 15). This method uses EEG data as task regressors, and hemodynamic changes are then inferred in response to electrical events such as inter-ictal spikes (Gotman and Pittau, 2011; Beers et al., 2015; Pittau and Vulliemoz, 2015; Vitali et al., 2015). It is believed that the region with the maximal BOLD response represents the spike onset zone (the area generating the interictal discharges), which may in turn be a marker of the seizure onset zone (An et al., 2013; Vaudano et al., 2013; Tousseyn et al., 2014; Khoo et al., 2018, 2017;). Thus, EEG-fMRI may yield complementary information within the presurgical workup of surgical remediable epilepsies and potentially impact on the clinical decision-making and patient management process (Zijlmans, 2007; Markoula et al., 2018).
In more recent years, task-based fMRI and EEG-fMRI paradigms have increasingly been complemented with task-free or resting-state acquisitions. Resting-state datasets can be used to map local functional parameters (Zhang et al., 2010; Hong et al., 2017; Jackson et al., 2017). Furthermore, literature has shown that resting-state fMRI connectivity analysis can be used to map multiple functionally relevant networks in a single session (Biswal et al., 1995; Greicius et al., 2003; Smith et al., 2009), offering a window into whole-brain functioning while not being very demanding for the participants (unlike task-based fMRI). In select epileptic cohorts, these tools identified atypical functional connectivity in both large-scale networks and in regions relevant to seizure generation (Lee et al., 2014; Bernhardt et al., 2016; Hong et al., 2019). As such, there is high potential for these techniques to enter clinical decision-making in epilepsy.
Diffusion-weighted imaging
Diffusion-weighted MRI (DWI) uses MRI sequences sensitive to diffusion of the water molecules in brain tissue and can be used to assess white matter architecture and microstructure. In the brain, the diffusion is restricted by intracellular and extracellular boundaries, with myelin being the main barrier. As such, the information contained in DWI images can guide algorithms that approximate and visualize white matter tracts in the brain by following pathways of unhindered water diffusion (a technique known as known as tractography). DWI data can also be used to extract voxel-wise parameters that reflect regional tissue properties. Widely used diffusion parameters are fractional anisotropy (indicating a preferred directionality of diffusion) and mean diffusivity (indicating the overall magnitude of diffusion). These parameters are usually inferred using a mathematical model of diffusivity known as “tensor”, which describes the magnitude of water diffusion in 3D space (hence the term “diffusion tensor imaging” which, however, is nowadays less frequently used). The analysis of tensor parameters, for example the study of hippocampal mean diffusivity, has been shown to be sensitive to localize and lateralize epileptic lesions such as hippocampal sclerosis (Assaf et al., 2003; Kim et al., 2014). However, ongoing research suggests greater validity of more complex analytical models, such as constrained spherical deconvolution which do not make the simplified assumption that there is only one major fiber direction in a given voxel (Maier-Hein et al., 2017; Raffelt et al., 2017). Similarly, tractography methods benefit from diffusion modelling that goes beyond the tensor, since at least 90% of voxels in the brain contain more than one fiber direction (Farquharson et al., 2013; Jones et al., 2013).
White matter tractography based on diffusion is important in epilepsy as seizures involve brain networks, and diffusion tractography allows visualization and, with appropriate techniques, quantitative evaluation of white matter pathways that make up the structural brain networks. This application of diffusion MRI requires three essential steps: the acquisition of appropriate DWI data; the correct estimation of fiber orientations, and finally, the application of an appropriate tracking algorithm. The reliability of tractography results is dependent on all three steps, and these steps are interdependent, i.e., data collection needs to be consistent with the intended data analysis method and vice versa (Farquharson et al., 2013).
DWI is not necessary for all patients with epilepsy undergoing epilepsy presurgical evaluation, but DWI-derived parameters can provide sensitive information for certain epileptic pathologies such as hippocampal sclerosis. Moreover, white matter tractography has potential to inform about the degree of functional loss post-surgically, especially when damage to key white matter tracts is possible. For example, tractography can be used to assess visual field loss when resection may damage Meyer's loop (Winston et al., 2011); visualization of the pyramidal tract could be used for prediction of the presence or absence of motor deficits when resection overlaps with the motor cortex (Guye et al., 2003).
Schematic representation
As simplistic summary of the sections above, figure 16 provides a schematic representation of the use of MRI during the presurgical evaluation of patients with refractory seizures, in the setting of surgical hypothesis forming and surgical planning.
Summary
MRI plays a central role in the management and evaluation of people with epilepsy. In patients with newly diagnosed epilepsy, the presence of an epileptogenic lesion on MRI significantly increases the risk of medication resistance. In patients being considered for epilepsy surgery, the presence of an epileptogenic lesion provides a surgical target and increases the chance of post-surgical freedom. Thus, it is critical that MRI scans are obtained early in the clinical course, using an optimized protocol (HARNESS-MRI). Furthermore, it is important that structural MRI scans are carefully reviewed by trained experts who have all available clinical data and investigation results. Consistent with the ILAE learning objectives for neuroimaging, this review provides a general overview of MRI pertaining to epilepsy diagnosis and evaluation, with these objectives in mind. Although the available resources can differ markedly across different centers, it is the hope of the Imaging Task Force that this review can provide guidance in the everyday practice of using MRI for patients with epilepsy.
Disclaimer
This report was written by experts selected by the International League Against Epilepsy (ILAE) and was approved for publication by the ILAE. Opinions expressed by the authors, however, do not necessarily represent the policy or position of the ILAE.
Disclosures
None of the authors have any conflicts of interest to disclose. We confirm that we have read the Journal's position on issues involved in ethical publication and affirm that this report is consistent with those guidelines.
 This work is licensed under a
Creative Commons Attribution-NonCommercial-NoDerivatives 4.0 International License
This work is licensed under a
Creative Commons Attribution-NonCommercial-NoDerivatives 4.0 International License