Epileptic Disorders
MENUMeasuring expertise in identifying interictal epileptiform discharges Volume 24, issue 3, June 2022

Epilepsy relies heavily on two main tools: the clinical history [1] and the EEG. Since its development in the 1920s [2], EEG recording capabilities have advanced, while interpretation has stayed largely the same. Identification of interictal epileptiform discharges (IEDs) is key in diagnosing epilepsy and currently achieved by visual analysis of the EEG. There have been attempts at standardizing criteria for identifying IEDs [3-5], however, accurately identifying IEDs remains largely a matter of apprenticeship and experience [6, 7]. Although formal training and experience are assumed to increase skill in EEG interpretation, no objective method currently exists to measure this, and there is only a set minimum for ACGME fellowship requirements [8].
Currently, both fellowship-trained and non-fellow-ship trained neurologists are permitted to interpret EEGs, however, neurology residencies provide varying amounts of exposure to EEG reading [9-11]. One survey found that many neurology residents (62.7%) have low confidence in interpreting EEGs independently [12]. This varied exposure translates to varying tendencies toward overcalling IEDs by classifying benign sharp transients or artifacts as IEDs [13-16]. One group found that misdiagnosis of epilepsy occurred in 25% of patients, with overinterpretation of EEG a contributing factor in 40% of cases [14]. Misdiagnosis can have serious implications, including cost of testing and medications, driving or work restrictions and adverse effects of anti-seizure drugs, while the actual diagnosis remains unknown and untreated [14, 17].
A valid IED skill assessment tool could measure a reader’s ability to interpret EEGs and reduce the risk of misdiagnosis. This tool should identify not only a reader’s accuracy, but also their consistency. It should also distinguish “over-callers” (readers with higher sensitivity but lower specificity) from “under-callers” (readers with higher specificity but lower sensitivity) across a wide range of obvious and ambiguous IEDs. For our study, we created an online tool to assess readers’ ability to identify IEDs (https://cdac.massgen-eral.org/tools/spikedetector/spikeTest). We had two main aims: (1) to determine whether test performance could reliably distinguish accurate readers from those who are not; and (2) to estimate the number of IED examples needed to measure a reader’s level of expertise with acceptable precision.
Methods
IED database
We used a database of 13,262 candidate IEDs, including benign variants, collected from 991 abnormal and 60 normal consecutively selected routine and continuous scalp EEGs of pediatric and adult patients performed at Massachusetts General Hospital between 2012 and 2016. The methods used to collect these candidate IEDs have been described in a prior publication [18]. Epileptiform waveforms were taken from those identified on abnormal EEGs and nonpathologic candidate IEDs were taken in combination from both abnormal and normal EEGs. Candidate IEDs included a mixture of focal, regional and generalized discharges. All EEGs were recorded using the standard 10-20 system (19-electrode array). Candidate IEDs were independently scored by eight epilepsy/CNP fellowship-trained physicians (“the original eight”) who scored each as either epileptiform or non-epileptiform [18]. Each candidate IED was then assigned a consensus probability of being an IED based on the judgement of a proportion of expert raters (0/8, 1/8.. .8/8). These results were considered the gold standard for the online IED classification test. For analyses that required dichotomous outcomes, we considered the correct binary answer to be “IED” for candidates with positive votes from ≥50% of the original eight, and “non-IED” for the remaining candidates.
Participants
Participants, here called “raters”, of different backgrounds were recruited through various methods of outreach including networking during national meetings (AES, ACNS, AAN), word of mouth and direct emails to individuals. These raters were distinct from the original eight used to define the gold standard. Raters were provided with a link to the online tool where they provided their name, affiliation, years of experience reading EEGs and whether they were a neurologist or epileptologist, and whether they were board certified. Raters were then classified into three categories: experts, experienced non-experts and novices. Raters who were neurologists and had completed at least one year of fellowship training in epilepsy or clinical neurophysiology were classified as experts. Board certification was not required because it is not a requirement for practice and is inconsistently present among EEG specialists. Raters who had not completed fellowship training but who had at least two or more years of experience reading EEGs in clinical practice or through research exposure, regardless of clinical background, were classified as experienced non-experts. All other participants were classified as novices.
Online IED classification test
The IED test presented each rater with 1,000 EEG samples selected from a pool of 13,262. The 1,000 candidate IEDs were different for each rater, and were randomly selected so that there were an equal number of candidate IEDs in each of the nine probability categories (0/8, 1/8, .. ., 8/8), based on the number of original eight raters who had scored each candidate IED [18].
Each participating rater viewed 1,000 candidate IEDs sequentially. The EEG was visualized within a 10-second window in multiple montages, including physical C2 vertebral referential montage, common average montage and longitudinal bipolar montage. One ECG channel was also included in each montage. Raters were free to increase or decrease the amplitude of all channels when viewing each candidate IED. A high-pass filter cut-off at 1 Hz and a notch filter at 60 Hz were applied to the data after it was resampled to 128 Hz. High-pass and low-pass filters could not be adjusted. For each candidate IED, the rater was asked to classify it as epileptiform or non-epileptiform. For each response, feedback was immediately provided to the rater showing a smiling face if correct relative to the gold standard (endorsed by 6/8-8/8 gold standard votes), a frowning face if incorrect (endorsed by 1/8-3/8 votes) and a neutral face for IEDs with 4/8-5/8 gold standard votes. These groupings were selected a priori when designing the online tool as a way to acknowledge differences between cases with clear expert consensus vs cases for which experts show substantial disagreement. Raters were not allowed to change responses after confirming a response. Rater responses were recorded for later analysis. In total, 53 raters participated in the study (excluding the original eight), of whom 29 rated at least 850 samples; all others were excluded. The institutional review board at the Massachusetts General Hospital approved the study and, because the study was considered to pose no risk to patients, waived the requirement for informed consent.
Calibration error (CE), sensitivity and false positive rate calculation
For each scorer, within each of the nine probability categories, we calculated the proportion of positive votes the participant cast. Calibration error was obtained by calculating the mean deviation of an individual’s rating of IEDs, within each probability category, compared to the expert consensus. Within each probability category (called a “bin”), the proportion of positive votes for the gold standard proportion was subtracted from the proportion of positive votes for each rater. For example, if a rater identified 44% of samples within a bin whose reference probability is 0.125 (1/8), the deviation would be 0.44 – 0.125 = 0.315. This procedure was repeated for each bin, and deviations were averaged to obtain the rater’s CE.
Next, the sensitivity and false positive rate for each rater were calculated. Samples were classified as IEDs (“spikes”) if the majority of experts (at least five of eight experts) voted positively, and non-IEDs otherwise. Sensitivity was defined as the proportion of positive samples correctly labeled as spikes. The false positive rate was the proportion of non-IEDs samples incorrectly labeled as spikes, in other words, how often normal waveforms were identified as IEDs.
Number of observations needed to measure performance
All participants were instructed to score 1,000 samples to provide ample data to estimate raters’ performance characteristics (sensitivity, false positive rate, calibration error) with high precision. However, scoring 1,000 samples is a substantial time investment, so we aimed to determine the minimum number (N<1,000) of samples needed to attain acceptably-precise estimates of a rater’s performance. We operationally defined estimates of sensitivity, false positive rate and calibration error as acceptably precise when the average (across participants) width of the 95% confidence intervals (CI) dropped below 0.1 for both sensitivity and false positive rate.
We calculated 95% CIs for sensitivity, false positive rate and CE for each rater for increasing numbers of observations (between 100 and 1,000) using bootstrapping (N=1,000). We averaged the width of the 95% CIs across all raters and determined the number of observations at 95% CI width <0.1 for all three performance metrics.
Model decision threshold and noise level (uncertainty) for each rater
To investigate the factors underlying differences in performance between raters within and between groups, we created a model of the decision process for candidate IED samples based on binary yes/no responses from each participant. We describe the methods involved in this modeling in the following section.
Results
Calibration error (CE), sensitivity and false positive rates
In total, 29 raters completed the test, of whom nine were clinical experts, seven were experienced nonexperts and 13 were novices. The answers that defined the “ground truth” IEDs provided by the original eight [18] were analyzed separately from those of the nine clinical experts.
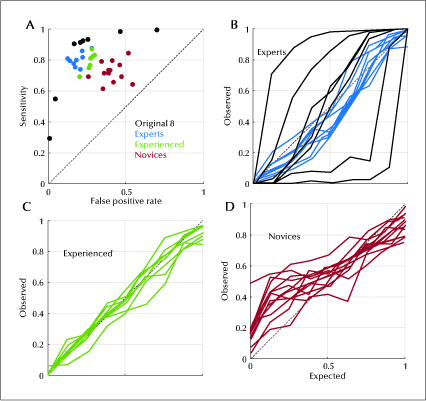
We calculated sensitivity and false positive rates for each participant. Sensitivity for experts was 0.800 (0.739, 0.876). Sensitivity for experienced non-experts was 0.811 (0.692, 0.870), and for novices was 0.715 (0.613, 0.845). False positive rate for experts was 0.177 (0.124, 0.277), for experienced non-experts was 0.272 (0.202, 0.295), and for novices was 0.396 (0.258, 0.542) (table 1). As shown in figure 1A, sensitivity increased and false positive rate generally decreased as the level of experience increased. Novices (red) tended to have the lowest sensitivity and highest false positive rates, while experts (blue) tended to have the highest sensitivity and lowest false positive rates, with experienced non-experts (green) falling in between. Responses from the original eight gold standard scorers are also shown for comparison (black).
Calibration curves were also created for the experts (figure 1B), experienced non-experts (figure 1C) and novices (figure 1D). Each curve shows the proportion of samples rated as IEDs compared to the proportion assigned by the eight gold standard raters. All three groups showed reasonably good median calibration, with ideal calibration being a diagonal line with a slope of 1. Calibration error was -0.056 (-0.074, 0.044) for experts, 0.012 (-0.080, 0.041) for experienced non-experts and 0.046 (-0.050, 0.163) for novices. Of the eight gold standard raters (black curves), there were two over-callers and two under-callers, as evidenced by curves falling higher and lower than the diagonal line, respectively.
Number of observations needed to measure performance
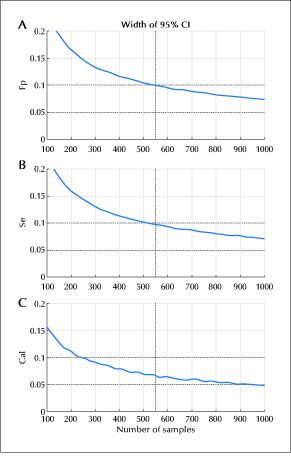
We calculated the number of samples each rater would need to score in order to measure their performance with a precision of at least 0.1, by calculating the 95% CI for false positive rate (figure 2A), sensitivity (figure 2B) and calibration error (figure 2C) as a function of the number of questions answered. The curves show the median values of each performance measure. The black dashed line shows the number of questions needed for the 95% CI width to fall below 0.1 for each performance statistic. This number was 549 for the false positive rate, 514 for sensitivity and 250 for the calibration error. Thus, 549 samples suffice to precisely estimate all three performance measures.
Framework for analyzing level of expertise in spike detection
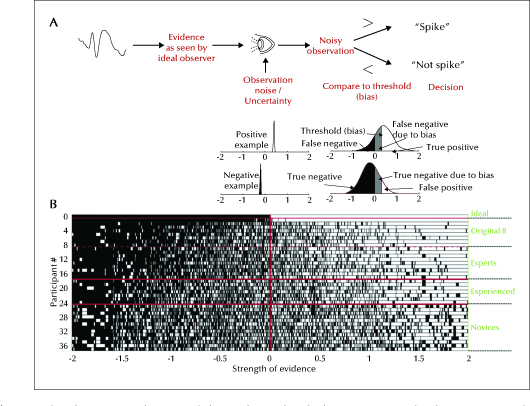
To investigate the factors underlying differences in performance between raters within and between groups, we created a model of the decision process for candidate IED samples based on binary yes/no responses from each participant, illustrated in figure 3A.
In our model, a given sample has a certain likelihood p of being interpreted as an IED by a rater, which we express on the logit scale z = ln(p/(1-p)); note that z can be positive or negative. The rater’s mental processes add noise (uncertainty) n to z, producing a noisy percept, z’ = z + n. The rater finally applies a threshold θ to reach a decision. If the resultant perceived evidence z’ is greater than the threshold θ, the rater classifies the candidate wave as an IED, otherwise as a non-IED.
The model has two parameters for each rater: the noise/uncertainty level σ, which reflects a rater’s skill in recognizing IEDs (an ideal rater would have a noise level of 0), and the threshold θ, which represents the rater’s personal preference as an over- or under-caller (a rater who neither over- nor under-calls would have a threshold of 0).
We estimated each rater’s decision parameters as follows. First, we expressed the true (gold standard) probability p for each IED on the logit scale, as z = ln(p/(1-p)). Then we added Gaussian noise n with varying standard deviations σ and thresholds θ to IEDs observed by the rater, and measured the resulting sensitivity and false positive rates, comparing these with the sensitivity and false positive rates actually observed for the rater. We identified the parameter values θ and σ that best matched the rater’s actual performance by performing a grid search, varying σ between 0 and 4, and θ between -3 and 3. For each combination (θ, σ), we defined the error E(θ, σ) as the squared difference between the rater’s actual sensitivity and the calculated sensitivity plus the squared difference of the rater’s actual false positive rate and the calculated false positive rate. The σ (noise level) and θ (threshold) at the global minimum of this error function E(θ, σ) were selected as the noise level and threshold that best describe each rater’s behavior. To construct a receiver operating characteristics (ROC) curve for each rater, we used the calculated noise level for that rater, and varied the threshold between 0 and 1 to calculate the sensitivity and false positive rate at each threshold level. We also calculated an ROC curve for each group by averaging group member ROC curves.
In figure 3B, we show a simulation of the decision process for the ideal observer (top row) and for each of the 37 scorers (including the original eight). This simulation uses the parameters estimated for the participants (see below). The location along the x-axis indicates the true (gold standard) underlying value (z), according to which samples to the left of z = 0 should be categorized as “non-spike” and those to the right of z = 0 as “spike”. Black marks indicate a given sample implicitly perceived as more likely being “not a spike”, while white marks indicate that the sample is perceived as most likely being a “spike”. Due to perceptual noise, some samples are colored white, left of the z = 0 line (false positives), and some black samples are colored black, right of the z = 0 line (false negatives). One can see that the amount of perceptual noise is greater for the novice group than for the expert or experienced non-expert groups.
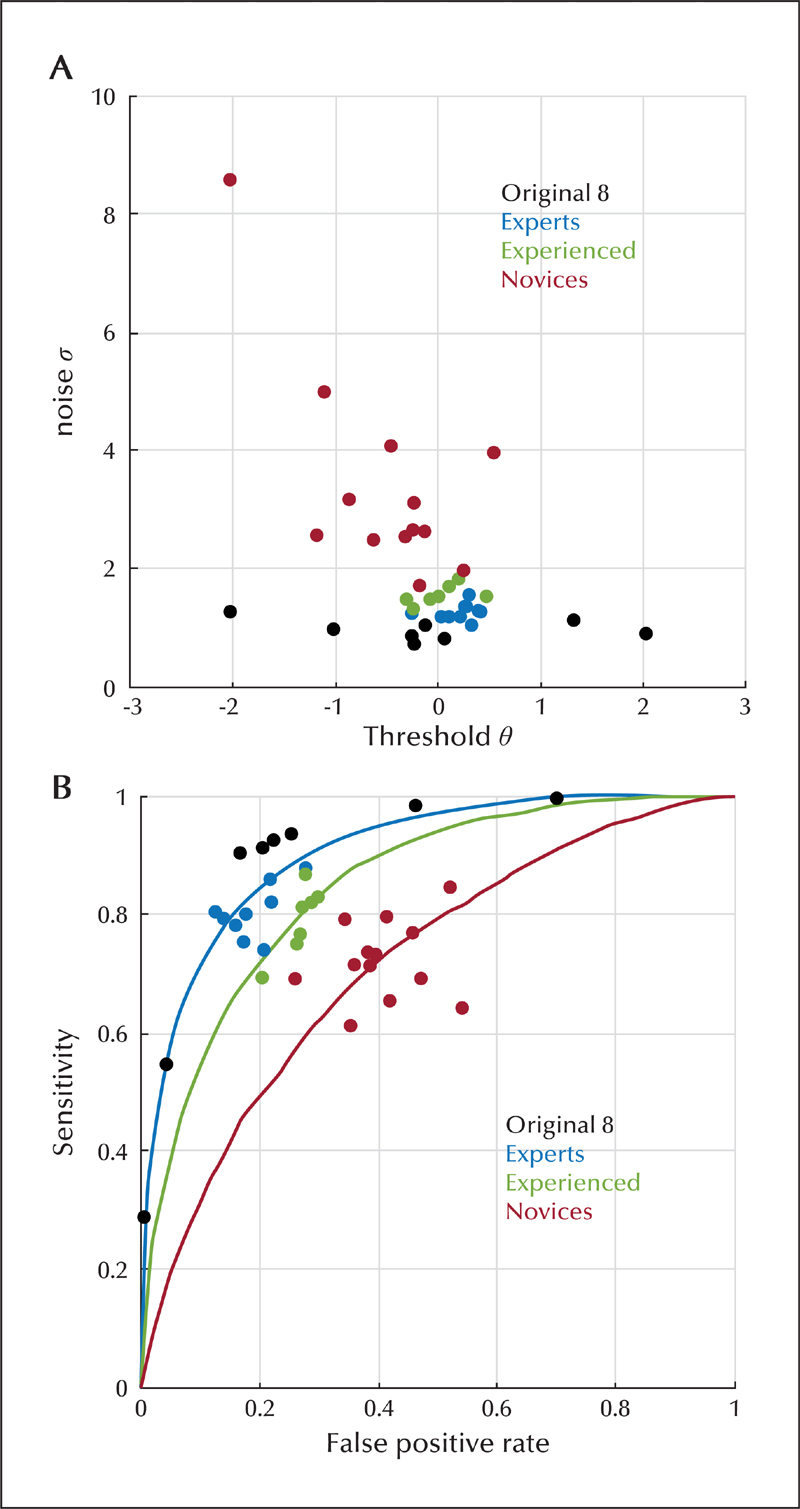
Estimated internal noise levels σ and threshold θ for experts (blue), experienced non-experts (green) and novices (red) are shown in figure 4A. As shown in table 2, the novice group had greater noise/uncertainty (σ = 2.664 [1.724, 8.577]) compared to experienced non-experts (σ = 1.541 [1.346, 1. 838]) and experts (σ = 1.262 [1.061, 1.575]). These group differences were significant (pairwise Mann-Whitney U-test p values: p1,3=1.1E-4, p1,2=5.2E-3, p2,3=4.9E-4; superscripts 1, 2 and 3 represent experts, experienced non-experts and novices, respectively).
The relationship of the threshold parameter θ to level of expertise was less clear. There was an increasing trend in group threshold levels, with novice thresholds tending to be more negative, favoring overcalling (θ = -0.313 [-2.021, 0.550]) relative to thresholds for experienced non-experts (θ = 0.004 [-0.304, 0.471]), and expert thresholds tending to be more positive, favoring under-calling (θ = 0.269 [-0.251, 0.410]). However, these differences were not all significant (p1,3=6.2E-3, p2,3=0.05, p1,2=0.17, respectively). Moreover, our data suggest that threshold values may be more variable among experts, particularly when including data from the original eight experts.
Using the calculated noise level for each rater, we generated an individualized ROC curve by varying the threshold between 0 and 1 and calculating the sensitivity and false positive rate at each threshold level. Figure 4B shows the resulting average ROC curves for experts, experienced non-experts without formal training and novices. The average area under the ROC curve increases as the level of expertise improves, from novices (0.735 [0.589, 0.843]) to experienced non-experts (0.852 [0.819, 0.882]), to experts (0.891 [0.845, 0.922]). There were significant group differences in area under the curve (AUC) between novices, experienced non-experts and experts (p<0.01).
Repeating the above analysis including the original eight experts (table 2) revealed overall similar results at the group level, both numerically and in qualitative trends, for σ noise level and θ thresholds, however, the original eight (black dots in figure 4A) showed a much wider spread in estimated θ threshold values. Results of AUC analysis were similar when the original eight experts were included, despite the fact that the gold standard was defined based on these eight raters.
Discussion
In this study, we developed a test to assess expertise in recognizing IEDs, a core skill in EEG interpretation. We found that, with this test, it is possible to distinguish experienced from inexperienced raters. Such a test would also need to be of sufficient length to adequately measure performance while not being excessively onerous. We determined that precision was acceptable (95% CI width <0.1) based on all three measures of performance after 547 candidate IEDs had been rated (figure 2A-C). This number can be considered a reasonable minimum test length to categorize a test taker’s skill level for IED detection. As a group, clinical experts and experienced non-experts had higher sensitivity and lower false positive rates, and operated on ROC with larger area (higher AUC), for classifying IEDs when compared to novices.
Calibration error, however, did not appear to be linked to level of expertise. In fact, calibration error varied most widely among experts, suggesting that over- and under-calling may be more related to an individual’s personal threshold rather than level of expertise. Our analysis suggests that there is a high level of agreement for experts regarding whether a waveform is an IED, however, the data vary because experts apply different thresholds to reach their final binary decisions. This new test advances the field of EEG interpretation by providing a quantitative instrument for measuring an individual’s skill and decision threshold in recognizing IEDs, the hallmark of epilepsy in routine EEG recordings.
The differences between the groups can be explained by examining training background. Fellowship training exposes trainees to a wide variety of nonepileptiform sharp waveforms, so-called “benign variants”, and different types of true IEDs. In addition, experts also read a relatively higher volume of EEGs with expert level supervision. Experienced non-experts did not have formal epilepsy or neurophysiology training, and had varying degrees of neurology training, but had been responsible for interpreting a substantial number of EEGs in clinical practice or research, while novices had the least amount of exposure. Several studies have shown that volume of exposure to EEGs is a factor influencing a rater’s ability to correctly identify epileptiform discharges [19, 20]. As such, high volume and varying exposure to EEGs remains an important aspect of learning. It is possible that with appropriate supervision and feedback, exposure to a large number of different EEGs could lead to competence in clinical interpretation, without formal fellowship training [19].
The significant variation in calibration error among experts warrants further comment. Within the original eight, there were four outliers. The two over-callers had higher sensitivity but also higher false positive rates; the two under-callers had lower false positive rates at the cost of lower sensitivities. Our model was able to account for these differences, allowing us to estimate the ROC curve that the experts appear to be operating on. Our analysis shows that experts generally operate on better ROC curves (higher AUC, better discrimination, less internal noise) than non-experts. In turn, calibration errors (tendency to under- or overcall) are attributable in this framework to differences in thresholds applied to the perceived probability that a sample is an IED. These differences can be understood by considering the training experts receive compared to experienced and novice raters. By reviewing a higher volume of EEGs and IED candidates, experts achieve higher levels of discrimination (better ROC curves) than non-experts. Nevertheless, because EEG readers are required to make a binary statement about whether IEDs are present vs absent in any particular EEG, they must choose a threshold. Unfortunately, without a universally agreed consensus as a basis to identify IEDs, these thresholds can relate to multiple factors, including a developed tendency to be an under-caller or an over-caller, differences in training, preferred criteria to identify IEDs, or even local group preferences. This further highlights the need for new techniques to unify interrater agreement.
Our results also support and expand upon prior work related to interrater agreement. Several prior studies suggested that there is poor interrater agreement among experts regarding IEDs [18, 21-26], and indeed our results show substantial disagreement in binary responses, especially among the original eight experts. One possible explanation is that different experts have very different concepts of what is or is not likely to be an IED. Alternatively, Jing et al. argued that disagreement among experts can be largely explained by varying thresholds each rater uses when making a decision [18]. Using the current data, we investigated this idea further by creating an explicit model to determine how different traits of a rater-namely their skill and decision threshold-relate to their ability to recognize IEDs and their tendency to over- orunder-call. Inourmodel(figure 3A), eachrater’s perception of the information in the EEG is subject to a certain amount of perceptual noise and internal thresholds. Despite variation in threshold values, experts operated on similar ROC curves (figure 4B). We interpret this as showing that experts tend to have relatively low levels of internal noise (higher skill level) but different operating thresholds when deciding to label samples as epileptiform when compared to novices. This helps to explain the variable findings regarding interrater agreement in prior studies, while supporting the previously asserted importance of expertise in EEG interpretation [16].
Even though experts operate on similar ROC curves, the observed over and under-calling of IEDs among experts remains problematic [13, 14, 17]. Such differences imply that an individual rater’s preferences may lead to variation in the diagnosis of epilepsy, even when the underlying evidence is identical. Therefore, an argument can be made to try to adjust individual thresholds of raters to obtain better agreement, and to reduce over- and under-calling. Using already established guidelines to identify IEDs [6, 27] in combination with a tool such as ours, it might be possible to train readers to behave more uniformly in rating IEDs. Understandably, while using a tool like this, it would be difficult to establish which threshold is “correct”. Alternatively, it may be worth considering an ordinal method to classify IEDs [26, 28]. Not imposing a binary threshold, especially in ambiguous cases, could prevent strict labeling of patients based on EEG, allowing for warranted uncertainty regarding a diagnosis of epilepsy. Similar to laboratory values or radiographic findings being weighed based on clinical context, EEG findings may be weighed differently if ordinal decisions are reported. While this approach may not accelerate diagnosis, it could help prevent erroneous diagnoses [29].
Our study has important limitations. First, we specifically examined IEDs. We chose to focus on IEDs because they are arguably the most important findings on an EEG in establishing the diagnosis of epilepsy [1, 7]. However, EEGs can be abnormal for other reasons and can change in the context of state of consciousness [22]. Some studies have shown that there is a higher level of interrater agreement in determining whether an EEG is abnormal even when there is disagreement over an individual IED being epileptiform [18, 22, 24, 30, 31]. A second limitation is the relatively small number of raters for each group. Given the previously mentioned variable interrater agreement among experts and different thresholds in discriminating IEDs, variance may be underestimated within the individual groups in our sample. A third limitation is that we defined “correct” answers based on expert consensus, without forcing experts to apply a set of explicit criteria. We feel that this is reasonable and matches the way experts learn to recognize IEDs (by experience through seeing many examples, rather than by applying explicit rules). Nevertheless, others advocate defining IEDs based on explicit criteria such as the six IFCN features [3]. While this approach also ultimately requires some degree of subjective judgement in applying the criteria, it is possible that this approach could lead to better agreement among experts. A fourth limitation is that our EEGs consisted of the conventional 19-channel 10-20 electrode configuration, however, a newer 25-electrode array has recently been proposed [32]. The 25-electrode configuration has not yet been adopted widely in the US and is not used in our institution. While the 25-electrode configuration has been shown to help with IED localization (especially temporal IEDs), it is not known whether the six additional electrodes influence inter-rater reliability in IED identification.
A topic not addressed in our study is how to improve agreement among EEG reviewers. One possible approach is to train reviewers to apply a set of standard criteria, such as the proposed six IFCN criteria for IEDs [3], and to instruct reviewers to “automatically” classify an example as an IED based on a minimal number of features present. However, as mentioned above, assessing such criteria still requires a certain level of subjectivity, and the criteria may not address all the characteristics of IEDs encountered in practice. An alternative strategy, that does rely on explicit criteria, could be to expand on the approach used in our study by providing feedback over an extended period, while allowing a rater to track over time how well they agree with expert consensus. Ultimately, some combination between consistent use of explicit criteria and the collective consensus of many expert readers may be needed to establish a comprehensive, high-quality “ground truth” about IEDs.
In conclusion, our results show that it is possible to quantify expertise in scoring candidate IEDs. With further development, our test, or one like it, could potentially be used to evaluate whether an individual is qualified to interpret EEGs clinically. However, further work is needed to establish the metrics and precise gold standard which should be used to qualify a reader as an “expert” based on test performance. Our results underscore the need for teaching methods and tools to improve consistency among EEG readers. Improving consistency would ideally lead to reduction in under- and over-calling of IEDs, and less frequent misdiagnosis of epilepsy.
Expert and non-expert readers can be distinguished based on ability to identify interictal epileptiform discharges (IEDs).
- We have developed an online test to quantify how well readers, with different training levels, recognize IEDs on EEG.
- Our results suggest the number of IEDs, needed to measure skill level with acceptable precision, is 549.
- Wepropose a decision model that estimates each reader’s skill and internal implicit bias.
Acknowledgements and disclosures.
NMH, JJ, JSH, JAK, ADL, AH, DM, IK, SSC, MS, GM, JJH, and MBW conceived the study idea, helped in acquisition and analysis of the data, and drafted a significant portion of the manuscript. FAN, SDH, YZ, PK helped in acquisition and analysis of the data, and drafted a significant portion of the manuscript. AO, WLZ, WG, SFZ, MN conceived of the study idea, helped in acquisition and analysis of the data. All authors discussed the results and contributed feedback to the final manuscript.
The authors would like to thank those who complete dour IEDTest (not included in authorship): Sam Terman (University of Michigan), Rani Sarkis (Brigham and Women’s Hospital), Dan Rubin (Massachusetts General Hospital), Garland Tang (Licking Memorial Hospital), Lindsay Joslyn(Hartford Healthcare), Maurice Abou Jaoude (Massachusetts General Hospital), Valeria Sacca (Magna Græcia University), Anil Palepu (Harvard-MIT Health Sciences and Technology), Elissa Ye (Massachusetts General Hospital), Julia Carlson (Massachusetts General Hospital), Lisa Dümmer (Massachusetts General Hospital), Ryan Gaudreau (Hartford Healthcare), Sean Bullock (Massachusetts General Hospital), Ziwei Fan (Massachusetts General Hospital), and Abubakar Muhammad Ayub (Massachusetts General Hospital). MBW and SSC are co-founders of Beacon Biosignals, which had no role in this work. FAN is part of the journal’s editorial board of Epileptic Disorders. Other authors have no conflicts of interest to disclose.