Epileptic Disorders
MENULow-grade tumour over the left temporal neocortex and ictal asystole: network and surgical implications Volume 23, issue 5, October 2021
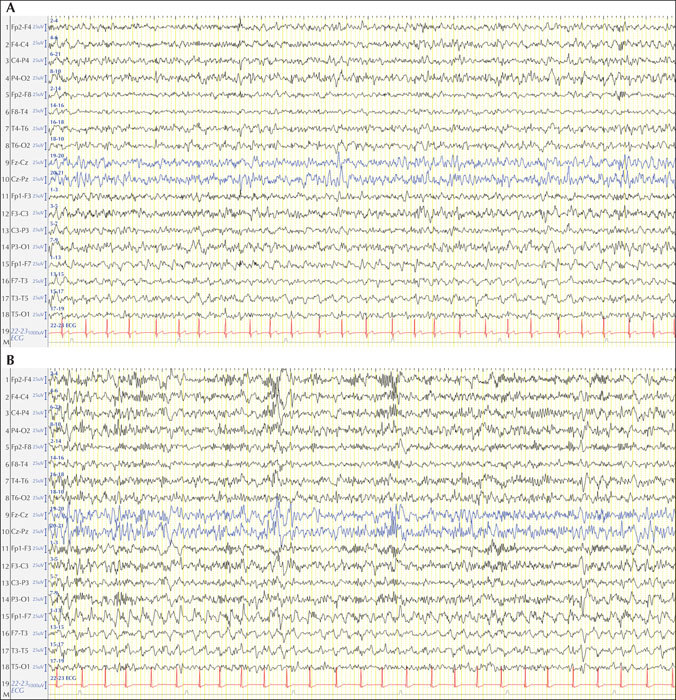
Figure 1
Sleep interictal EEG. (A) Normal background activity with intermittent polymorphic medium-amplitude theta activity over the left temporal region. (B) Medium-high-amplitude rhythmic slow activity over the left temporal region (likely a subclinical seizure).
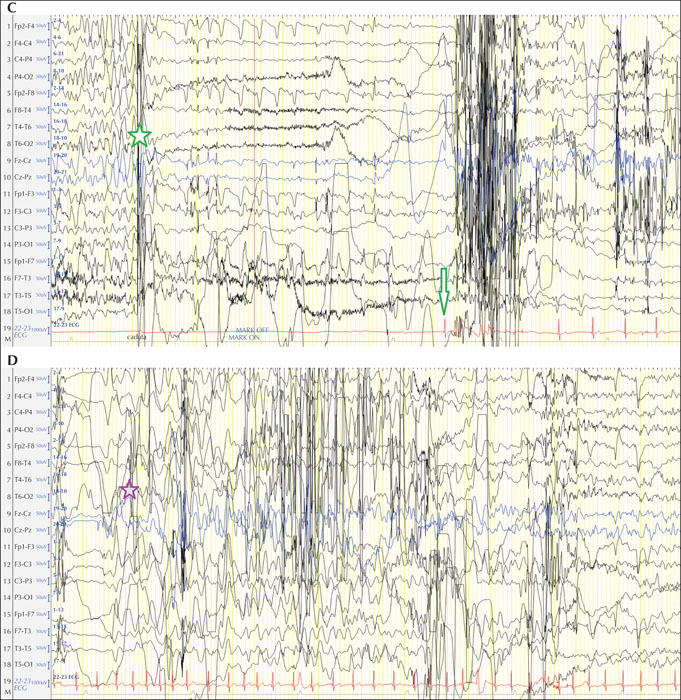
Figure 2
(A-D) Awake ictal EEG. Seizureonset characterized by background flattening over the left temporal region (large blue arrow), followed by a fast recruiting activity (small blue arrow); the latter is difficult to see because of muscular artifact covering the brain activity. Subsequently, a medium-high-amplitude polymorphic and rhythmic theta-delta activity over the antero-mesial left hemisphere appears (large orange arrows). After 30 seconds, a medium-amplitude monomorphic and rhythmic fast activity over temporal electrodes is observed (red arrow), with which a clear change of both associated ipsi- and contralateral hemispheric activity (horizontal red line). At the end of this last recruiting discharge, the activity preceding it returns over the antero-mesial left hemisphere (small orange arrows) and after four seconds, cardiac arrest occurs (green arrow). After 10 seconds from the cardiac arrest, a widespread EEG suppression appears (red star) and after another 14 seconds, the cardiac rhythm reappears (green arrow). Fourteen seconds after cardiac rhythm recovery, the brain background activity reappears (violet star).
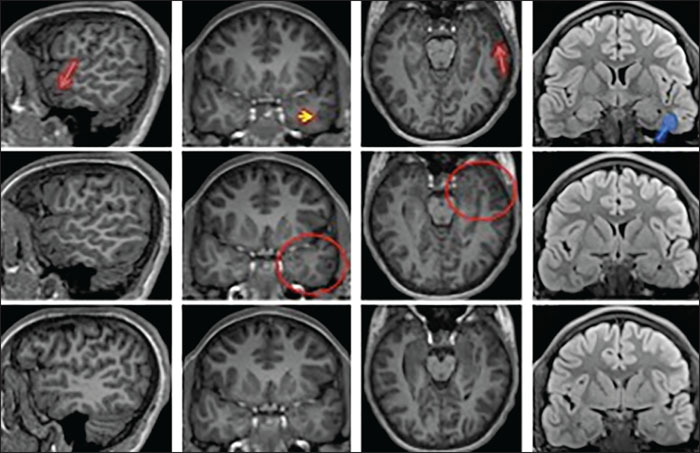
Figure 3
Coronal T1 brain MRI showing magnetic signal modification over the middle temporal gyrus (red arrows), up to the sulcus between the middle and inferior temporal gyrus (yellow arrow), with signs of blurring and reduced volume on the left temporal pole compared to the right (red circles). Coronal FLAIR brain resonance image showing peri-tumour hyperintensity.
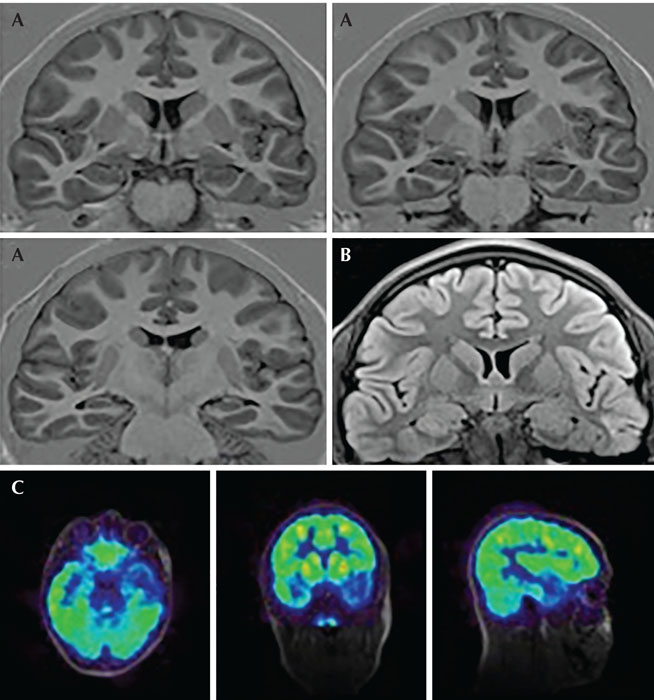
Figure 4
(A) Coronal T1 brain MRI showing a possibly slightly smaller size of the posterior left hippocampus. (B) Coronal FLAIR brain MRI showing normal amygdales. (C) Brain FDG-PET superimposed on brain MRI showing diffuse left antero-mesial temporal lobe hypometabolism.
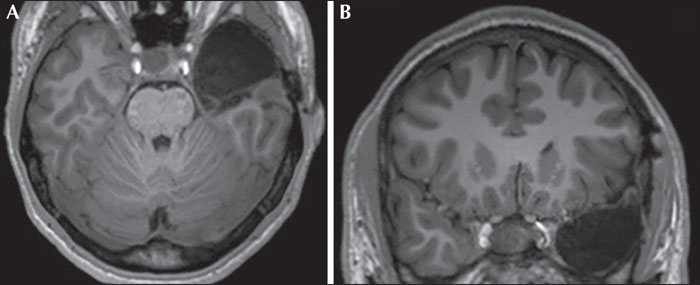
Figure 5
Surgical resection area on coronal T1 brain MRI (A) and axial T1 brain MRI (B).

