Epileptic Disorders
MENUEpilepsy surgery for polymicrogyria: a challenge to be undertaken Volume 20, numéro 5, October 2018
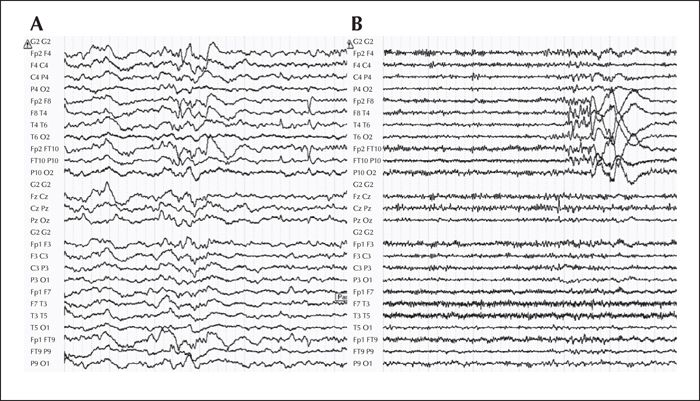
Figure 1
Interictal scalp EEG findings. Illustration of a typical interictal EEG pattern in occipito-temporal unilateral PMG displaying right temporal theta activity and two types of focal paroxysms: (A) sharp waves, maximal at electrodes FT10 and F8; and (B) 8-Hz polyspikes, followed by a high-amplitude delta wave, maximal at electrodes T4, T6 and FT10.
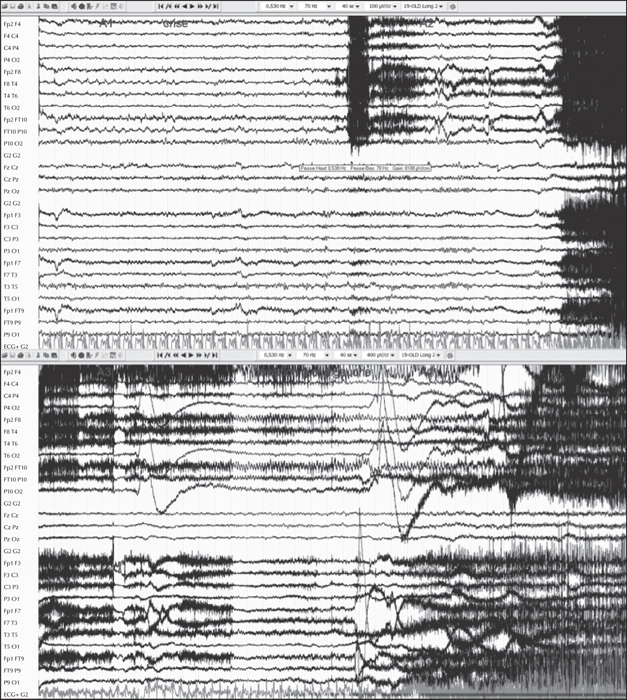
Figure 2
Ictal scalp EEG findings. Illustration of the initial ictal discharge associated with the usual seizures associated with occipito-temporal unilateral PMG. The first ictal modifications are characterized by a right hemispheric flattening, followed by a focal right temporal (FT10, F8, T4, FP10) alpha (8-Hz) rhythmic discharge.
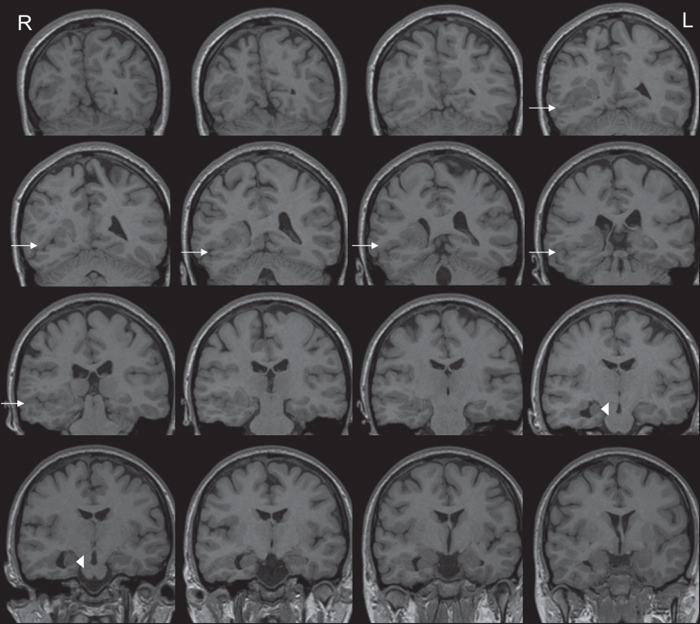
Figure 3
MRI findings. Cranial MRI (coronal T1 images) showing widespread right regional occipito-parieto-temporal PMG surrounding a closed lip SCZ (arrow), extending from the lateral occipito-temporo-parietal junction to the right lateral ventricle. Associated malformations comprised a periventricular nodular heterotopia and a malrotation of the right hippocampus (arrow head).
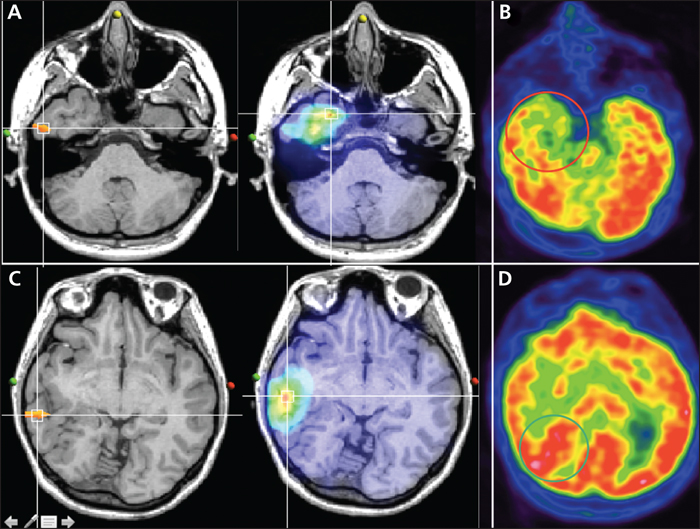
Figure 4
Electrical source imaging and FDG-PET findings. ESI derived from HR-EEG identified two sources: (A) medial and lateral temporo-polar remote from the PMG and (C) lateral temporal, located in the middle part of the PMG. FDG-PET showed significant hypometabolism in the right temporal pole, consistent with the first source (B), whereas the most posterior part of the PMG, lining the schizencephalic cleft, appeared isometabolic (D).
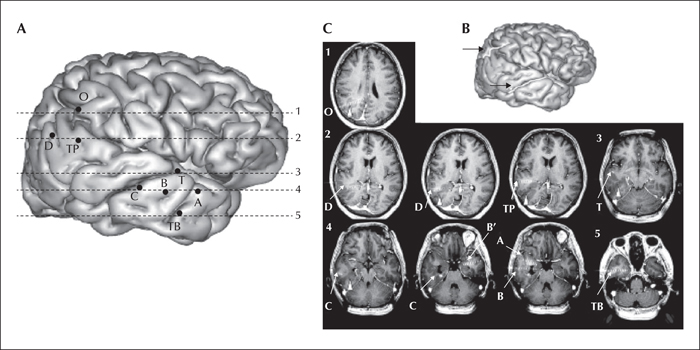
Figure 5
(A-C) SEEG implantation scheme. Eight electrodes were placed in the right hemisphere targeting the amygdala (internal contacts of A), hippocampus (internal contacts of B), and parahippocampal gyrus (internal contacts of TB), the PMG cortex along the middle and superior temporal gyrus (external contacts of A, B, C, T, TP), the PMG cortex lining the anterior and posterior lip of the SCZ (middle and external contacts of D and O), and the nodular heterotopias (internal contacts of D).
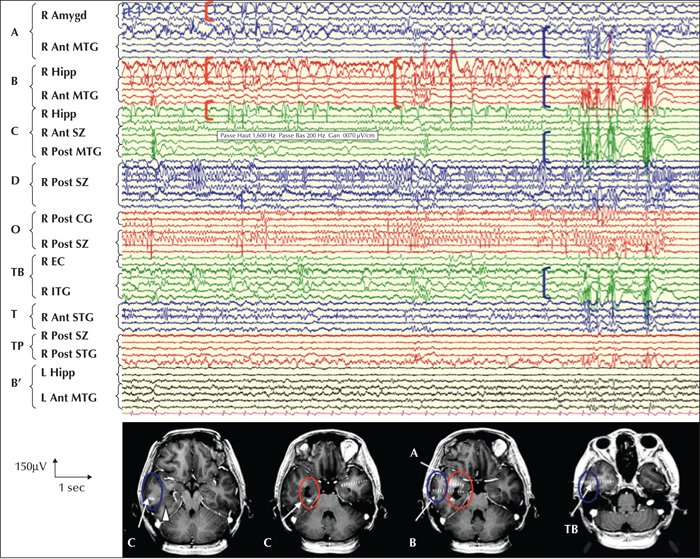
Figure 6
Interictal SEEG findings. Red markers correspond to frequent spike-wave activity within the right hippocampus (electrodes B and C, internal contacts) and amygdala (A, internal contacts). Blue markers correspond to independent bursts of polyspike-waves recorded in the right middle temporal gyrus (A, B and C, external contacts) and inferior temporal gyrus (TB, external contacts). The anterior and posterior SCZ (C, D and O), right anterior and posterior superior temporal gyrus (T and TP), right rhinal cortex (TB), and left hippocampus (B0) display normal interictal background activity.
R: right; Amygd: amygdala; ant: anterior; MTG: middle temporal gyrus; Hipp: hippocampus; SZ: schizencephaly; post: posterior; CG: cingulate gyrus; EC: entorhinal cortex; ITG: inferior temporal gyrus; STG: superior temporal gyrus; L: left.
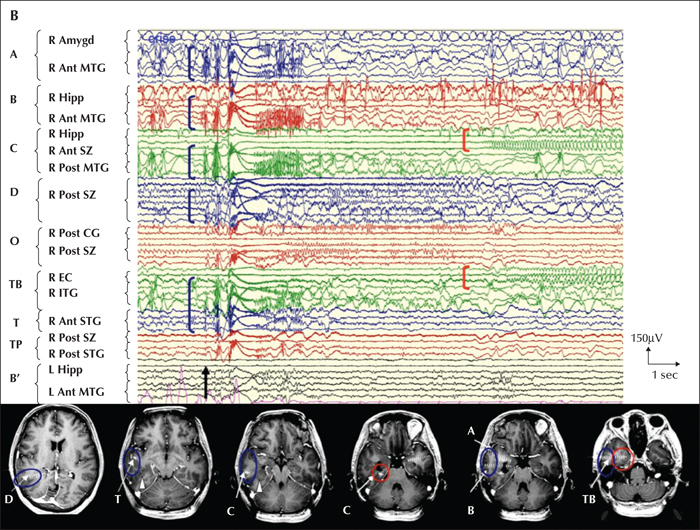
Figure 7
Ictal SEEG findings. (A) SEEG recording of a right anterior mesio-lateral temporal seizure. The black arrow indicates the seizure onset, characterized by an initial high-amplitude spike-wave and fast low-voltage discharge localized in the amygdala (A, internal contacts) and hippocampus (B and C, internal contacts, red markers), and then, two seconds later, in the middle and inferior temporal gyri (A, B, C and TB, external contacts), followed by a slower rhythmic alpha spike discharge in the superior temporal gyrus (T) (Continued p. 332). (B) SEEG recording of a right lateral, basal and posterior temporal seizure. The black arrow indicates the seizure onset characterized by a polyspike immediately followed by a fast low-voltage discharge (blue markers) localized in the middle temporal gyrus (A, B and C, external leads), inferior temporal gyrus (TB, external leads), and superior temporal gyrus (T and TP), extending to the posterior SCZ (D). Secondary propagation to the right hippocampus and entorhinal cortex (C and TB, internal leads) is indicated by red markers.
R: right; Amygd: amygdala; ant: anterior; MTG: middle temporal gyrus; Hipp: hippocampus; SZ: schizencephaly; post: posterior; CG: cingulate gyrus; EC: entorhinal cortex; ITG: inferior temporal gyrus; STG: superior temporal gyrus; L: left.
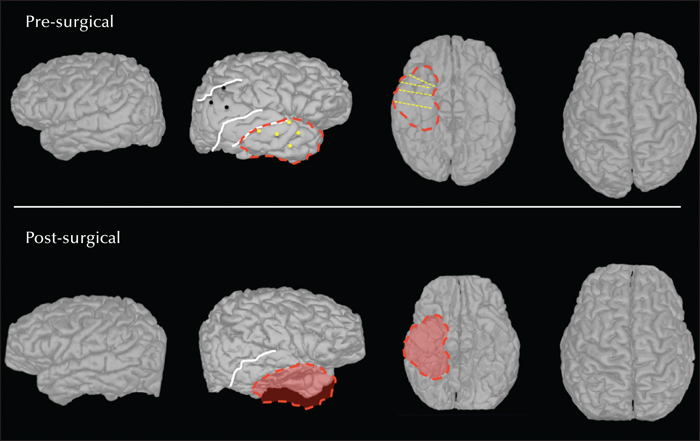
Figure 8
Relationship of the PMG to the epileptogenic zone and the resection. Comparative presentation derived from the pre- and postsurgical 3D-MRI of the PMG (white lines delineate the cleft of the associated SCZ), implantation scheme, and epileptogenic and resection zone (dotted red line). On the lateral view, the entry points of each electrode are presented. On the inferior view, only the trajectories of the electrodes exploring the basal and medial aspects are presented. Yellow points/lines indicate electrodes involved in the initial ictal discharge.

