Epileptic Disorders
MENUA case of repetitive seizures following immune checkpoint inhibitor therapy as a feature of autoimmune encephalitis Volume 23, numéro 5, October 2021

Figure 1
MRI and FDG-PET. (A) On the day of the first seizure, brain MRI (axial and coronal FLAIR images) did not show any hyperintensity or atrophy in the brain including the bilateral limbic system. (B) On the 45th day after the first seizure, FDG-PET showed no change in the metabolism of the brain including the bilateral limbic system.

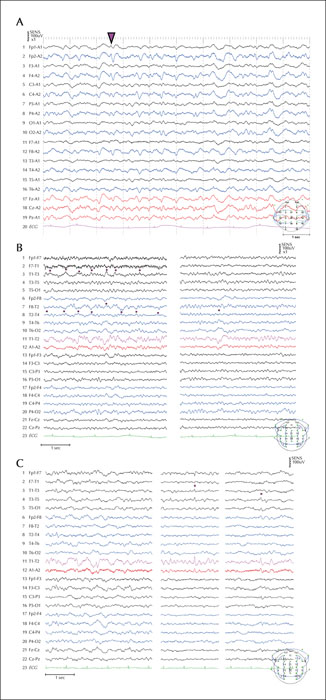
Figure 2
Interictal EEGs. The EEGs are presented with a time constant of 0.3 seconds, and a high frequency filter of 60 Hz. (A) Post-ictal EEG showing generalized slow activities and triphasic waves (pink arrowhead), suggestive of metabolic encephalopathy on the day of the first seizure. (B) On the 45th day after the second seizure, the interictal EEG shows bilateral and right-dominant intermittent semi-rhythmic (but occasionally rhythmic) delta activities, and bitemporal intermittent delta waves. These focal slow waves appeared in the right and left temporal regions independently at irregular intervals. Pink dots indicate a region with a negative phase reverse. (C) On the 85th day after the second seizure, interictal EEG still shows irregular and intermittent slow waves in the temporal regions. Sharp transient waves, which are frequent in the left temporal region, are also visible. Pink dots indicate a region with a negative phase reverse.

