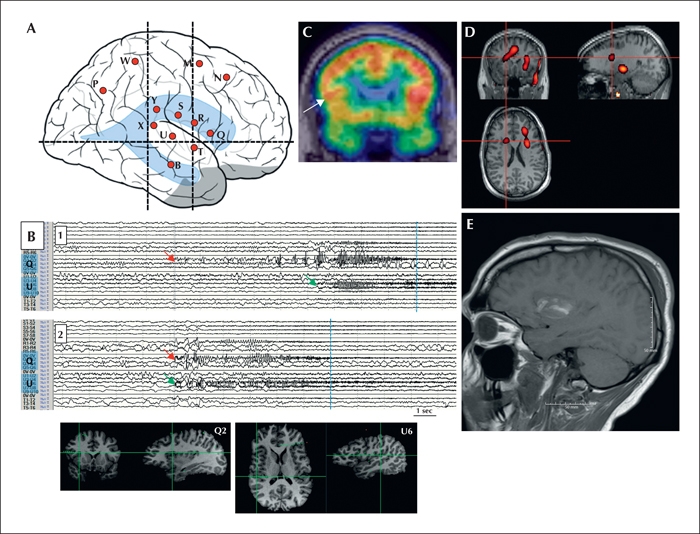
(A) Right-sided SEEG schema with 12 depth electrodes exploring the anterior and posterior perisylvian region (electrodes Q-T) and mesial frontal region/supplementary motor area (SMA; electrodes M and N). (B) Two representative seizures showing onset at contacts Q1,2 (frontal operculum/insula; red arrow) and U6,7 (planum temporal; green arrow) on a 15-second page (band pass: 5.3-300 Hz). The onset at these contacts was simultaneous in the second example, though in the first example the ictal discharge at U5,6 was delayed relative to that at Q1,2. These seizures occurred during sleep without report of aura. Clinical onset is denoted by the blue line. In other seizures, including the one with reported auditory aura, a build-up of spiking occurred in contacts Q1,2 for tens of seconds prior to ictal onset. Prominent early involvement was also noted in the mesial contacts of M and N (SMA; not shown), in addition to neighbouring perisylvian contacts. (C) Interictal FDG-PET showing hypometabolism in the right frontal operculum (arrow). (D) Ictal SPECT (Z=2) of a typical seizure recorded prior to SEEG evaluation. Injection was performed at nine seconds from clinical onset. There was a dominant focus in the left frontal operculum/insula and anterior cingulum. A lesser degree of hyperaemia was seen in the right insular region (crosshairs). Semiology of this seizure involved left face tonic contraction, suggestive of right opercular activation. (E) Post-resection MRI showing defect in the right frontal operculum and subjacent insula.
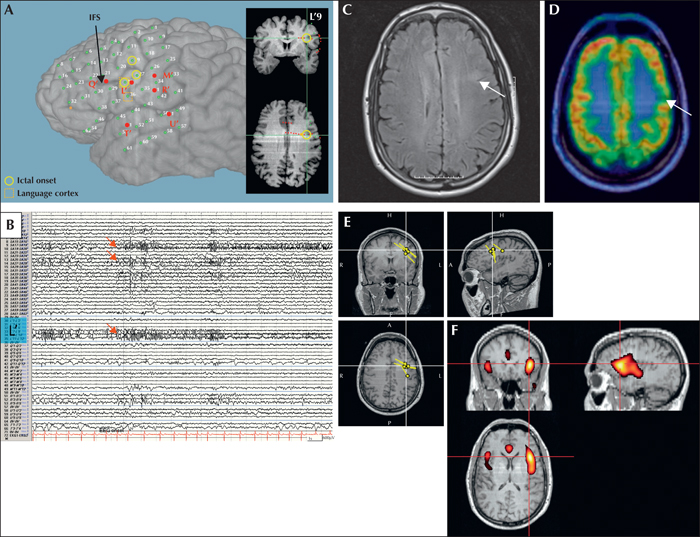
(A) Left-sided perisylvian subdural and depth electrode implantation with electrodes targeting the suspected lesion in the inferior frontal sulcus (L’). The inferior frontal sulcus (IFS) is indicated. (B) Ictal onset with tonic fast activity, most prominent in L’9 (see inset in [A]) and overlying subdural contacts (SA19, 27, 28; denoted as yellow circles in [A]) on a 20-second page (band pass: 5.3-120 Hz). Clinical onset occurred approximately 20 seconds later (not shown). The ictal onset zone overlapped with language cortex, as determined by cortical stimulation (boxed; contacts 28 and 36). (C) Axial FLAIR showing subtle T2 hyperintensity suggestive of focal cortical dysplasia. (D) Interictal FDG-PET showing hypometabolism of the left frontal operculum. (E) Single equivalent dipole model of MEG-unique epileptiform activity. Dipoles were clustered in the region of the right inferior frontal sulcus. (F) Ictal SPECT (Z=2) in a typical seizure recorded prior to SEEG evaluation. Injection was performed at 14 seconds from onset. A dominant focus of hyperaemia is seen extending from the left frontal to the left temporal operculum.
Auditory auras are typically considered to localize to the temporal neocortex. Herein, we present two cases of frontal operculum/perisylvian epilepsy with auditory auras. Following a non-invasive evaluation, including ictal SPECT and magnetoencephalography, implicating the frontal operculum, these cases were evaluated with invasive monitoring, using stereoelectroencephalography and subdural (plus depth) electrodes, respectively. Spontaneous and electrically-induced seizures showed an ictal onset involving the frontal operculum in both cases. A typical auditory aura was triggered by stimulation of the frontal operculum in one. Resection of the frontal operculum and subjacent insula rendered one case seizure- (and aura-) free. From a hodological (network) perspective, we discuss these findings with consideration of the perisylvian and insular network(s) interconnecting the frontal and temporal lobes, and revisit the non-invasive data, specifically that of ictal SPECT.