Epileptic Disorders
MENUA case of auditory auras: application of general principles to define and localize the epileptogenic zone Volume 8, supplément 2, Supplement 2, September 2006


Figure 1 Interictal scalp record showing a sleep epoch with left temporal sharp waves at the left sphenoidal (Sp1) electrode.

Figure 2 Ictal scalp EEG showing clinical onset when patient pushed (see marker) seizure button at the onset of auditory aura without any significant EEG change.
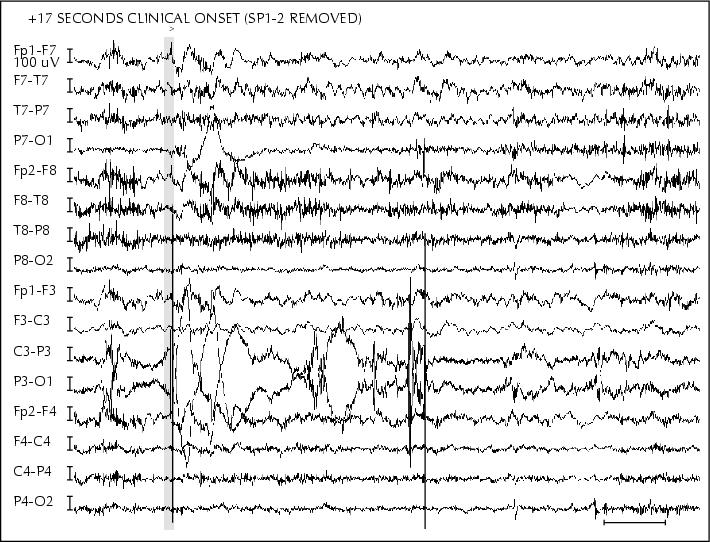
Figure 3 Ictal scalp EEG showing clinical onset when patient pushed (see marker) seizure button five seconds later, left temporal seizure pattern was noted.

Figure 4 Brain FDG-PET coronal slices showing left temporal hypometabolism in the left temporal pole, mesial temporal structures and extending in to the lateral superior and middle lateral temporal lobe (slices 32-53 in the bottom two rows).

Figure 5 Electrocorticography showing distribution of interictal discharges recorded from the implanted subdural electrodes in the left anterior lateral region. Inset brain cartoon shows corresponding regions inside the circle.

Figure 6 Electrocorticography showing distribution of interictal discharges recorded from the implanted subdural electrodes in the basal anterior mesial temporal region. Inset brain cartoon shows corresponding regions inside the circle.

Figure 7 Electrocorticography showing a poorly localizable ictal onset zone over the lateral temporal convexity during a typical complex partial seizure at the onset into the seizure. Inset brain cartoon shows corresponding regions at the darkened (filled in) electrodes.
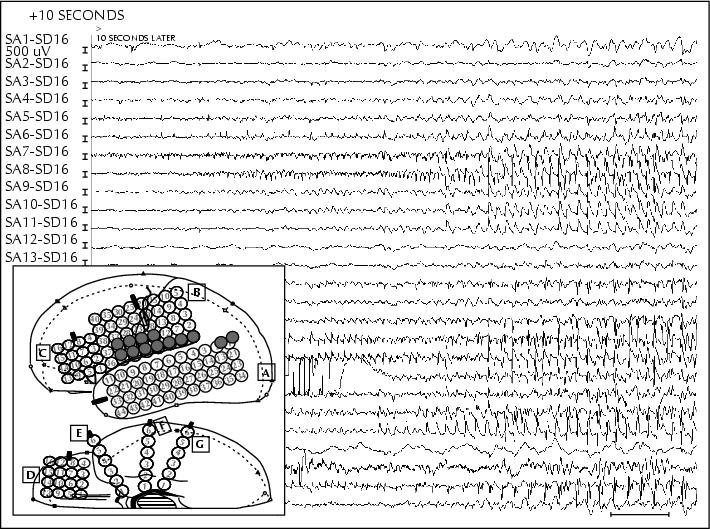
Figure 8 Electrocorticography showing a poorly localizable ictal onset zone over the lateral temporal convexity during a typical complex partial seizure at 10 seconds into the seizure. Inset brain cartoon shows corresponding regions at the darkened (filled in) electrodes.

Figure 9 Electrocorticography showing focal ictal onset at the left mesial basal temporal lobe during a typical prolonged auditory aura. Inset brain cartoon shows corresponding regions at the darkened (filled in) electrodes.

Figure 10 Electrocorticography showing seizure spread at the left mesial basal temporal lobe during a typical prolonged auditory aura. Inset brain cartoon shows corresponding regions at the darkened (filled in) electrodes.

Figure 11 Final map generated after invasive evaluation using subdural array and planned resection of brain under the electrodes inside the circle. SEP = Central sulcus localization by somatosensory evoked potentials; Stim Sz. = seizures recorded after electric stimulation of electrodes; Stim aura = Auditory auras recorded after electric stimulation of electrodes; Co-reg MRI = Central sulcus localization by coregistered magnetic resonance imaging.

Figure 12 Post-operative brain MRI showing coronal and sagittal T1 weighted images after resection of the anterior and middle portion of the left superior temporal gyrus.